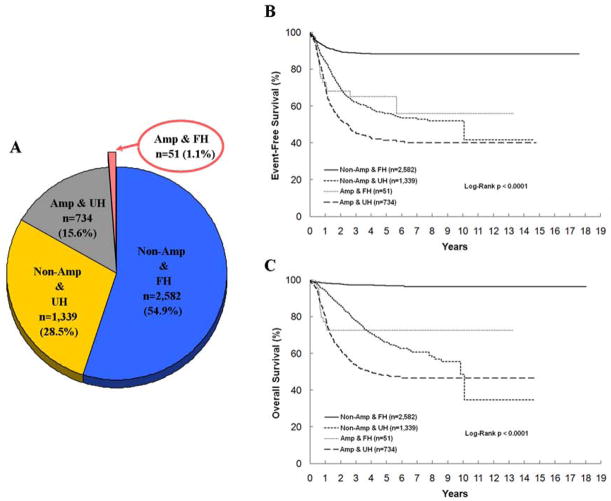
Figure 1.
Four subsets of peripheral neuroblastic tumors by MYCN status and histopathology classification for all patients registered in the Children’s Cancer Group and the Children’s Oncology Group studies (n=4,706). A: Pie-graph illustrating the proportion of patients in those subsets with an arrow pointing to the genotype-phenotype discordant subset. B: Kaplan–Meier curve for event-free survival of patients in those subsets. C: Kaplan–Meier curve for overall survival of patients in those subsets; Non-Amp & FH, MYCN non-amplified and Favorable Histology subset; Non-Amp & UH, MYCN non-amplified and Unfavorable Histology subset; Amp & FH, MYCN amplified and Favorable Histology subset; Amp & UH, MYCN amplified and Unfavorable Histology subset.

