
Figure 7.
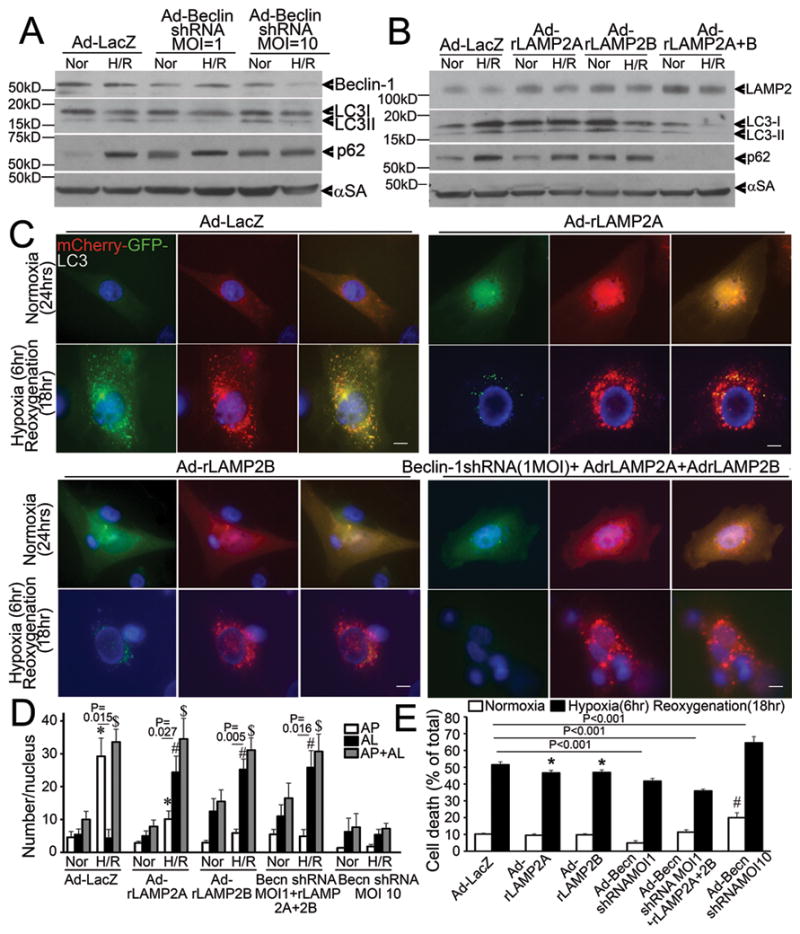
Beclin-1 knockdown and LAMP2 overexpression restore autophagosome processing and rescue cell death in NRCMs subjected to hypoxia-reoxygenation injury. A) Immunoblot depicting BECLIN-1, LC3 and p62 abundance in NRCMs treated with increasing dose of adenovirus transducing Beclin-1 shRNA (for 48 hours) and subjected to hypoxia-reoxygenation (H/R: 6/18 hours) or normoxia (Nor) as control. Representative of n=2 experiments. B) Immunoblot depicting LAMP2, LC3 and p62 expression in NRCMs transduced with adenovirus expressing rat LAMP2A and rat LAMP2B (each 10 MOI) for 24 hours and subjected to hypoxia-reoxygenation as in A. Representative of n=2 experiments. C) Representative immunofluorescent images (630X) depicting mCherry-GFP-LC3 expression in NRCMs transduced with adenovirus expressing LacZ (control), rat LAMP2A, rat LAMP2B (10MOI each); and Beclin-1shRNA (1MOI) + rat LAMP2A (10 MOI) + rat LAMP2B (10 MOI) and subjected to hypoxia-reoxygenation as in A and B. Scale bars= 10μm. D) Quantitative analysis of autophagosomes (white bars), autolysosomes (black bars) and both (gray bars) in NRCMs treated as in C. * indicates P< 0.05 vs normoxia for autophagosomes, # indicates P< 0.05 vs normoxia for autolysosomes, $ indicates P< 0.05 vs normoxia for autolysosomes+autophagosomes within the same treatment condition (n=15–20 nuclei/group) by post-hoc test. P values depicted are by paired t-test within each group. E) Cell death in NRCMs adenovirally transduced with LacZ (control), rat LAMP2A (10 MOI), rat LAMP2B (10 MOI), Beclin-1 shRNA (1 MOI), Beclin-1 shRNA (1MOI) + rat LAMP2A (10 MOI) + rat LAMP2B (10 MOI); and Beclin-1 shRNA (10 MOI) as in C. P values indicated are by post-hoc test (n=8–40/group). * indicates P< 0.05 vs LacZ treated hypoxia-reoxygenation group, # indicates P< 0.05 vs LacZ normoxic control.