
Fig. 3.
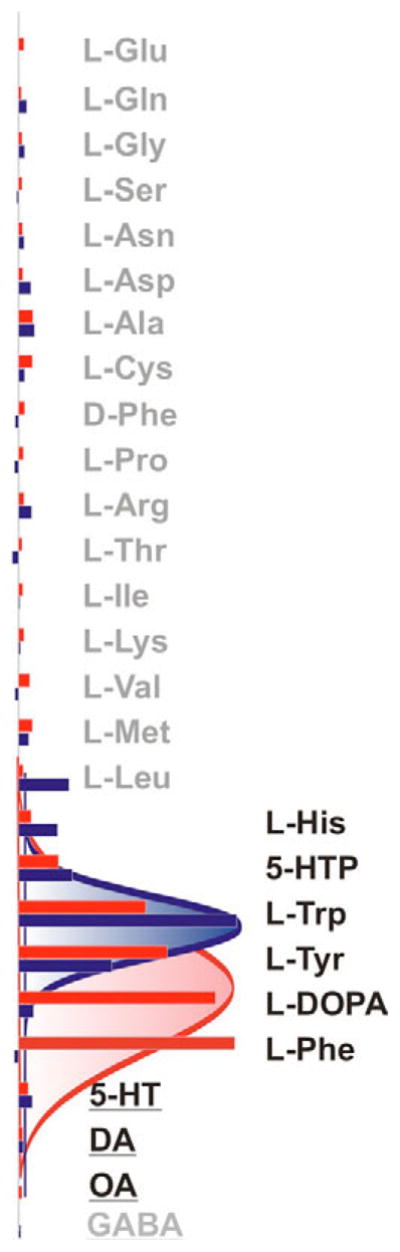
Relative transport efficiency of aromatic NATs. Normalized means (bars) of selected substrate-induced currents were acquired from independent oocytes (N ≥ 3 for each data point). All responses were measured using standard conditions (98 mmol·l−1 Na+ oocyte perfusion saline, 50 mV holding potential, and 1 mmol·l−1 of organic substrate concentrations). Data sets for AgNAT6 (blue set) and AgNAT8 (red set) were normalized relative to Trp- and Phe-induced responses and sorted with respect to amplitudes of induced currents and chemical substrate properties. Final data sets were fitted using a four parameters Gaussian pick function: f=y0+aexp{−0.5[(x−x0)/b]^2} indicated by red and blue lines. Substrate groups are indicated by different font styles: neurotransmitter, underlined; aromatic substrates, solid black; and all others gray.