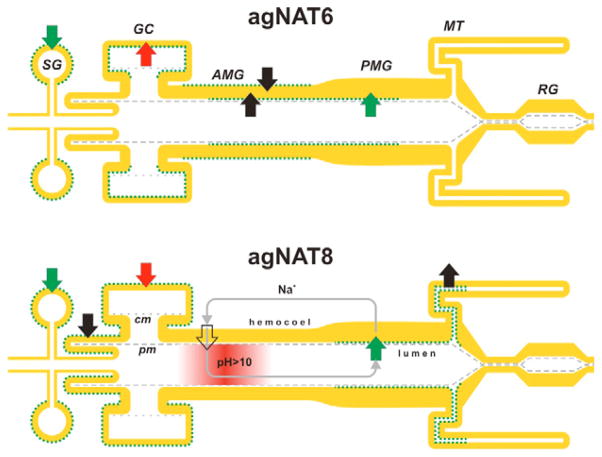
Fig. 6.
A diagram of the relative distribution of aromatic AgNATs in the model system of the larval alimentary canal. A summary diagram composed from whole-mount and frozen section preparations is shown (N>20 for each transporter). Green dotted lines indicate membrane docking of the transporters. Colored arrows indicate direction of transport at specified locations. Their colors show either the same (green), specific (black) and opposed directions of substrate transport by AgNAT6 (top part) compared with AgNAT8 (bottom part). Gray arrows show a putative circuit of cation recycling via alkalinization (pink gradient region) and NAT-coupled pathway. Empty arrow indicates location of a putative H+ V-ATPase and cation exchanger-coupled mechanism for cation translocation in the AMG. SG, salivary gland; GC, gastric caeca; AMG, anterior midgut; PMG, posterior midgut; MT, Malpighian tubes; RG, rectal gland; cm, caecal membrane; pm, peritrophic membrane.

