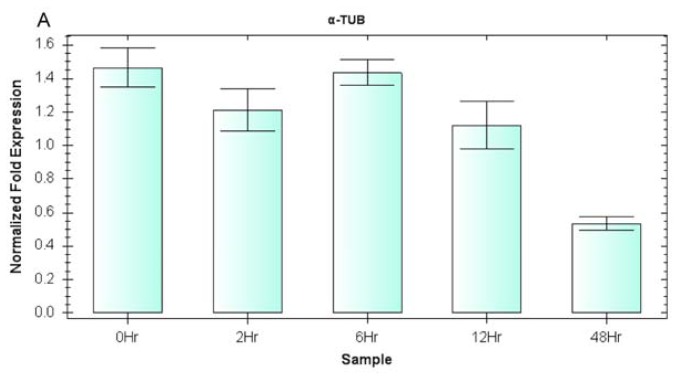
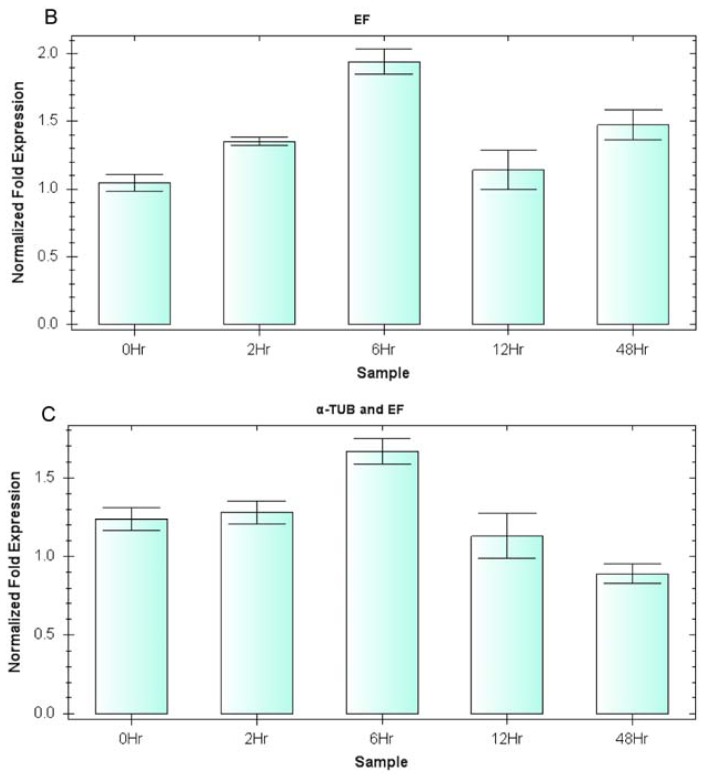
Figure 5.
The expression of EsDREB2 in response to drought stress. Relative gene expression was analyzed after plants were exposed to 0 h, 2 h, 6 h, 12 h and 48 h of drought stress conditions. Normalization was performed using α-tubulin (α-TUB) alone (A), EF alone (B) or the combination of α-TUB and EF (C).


