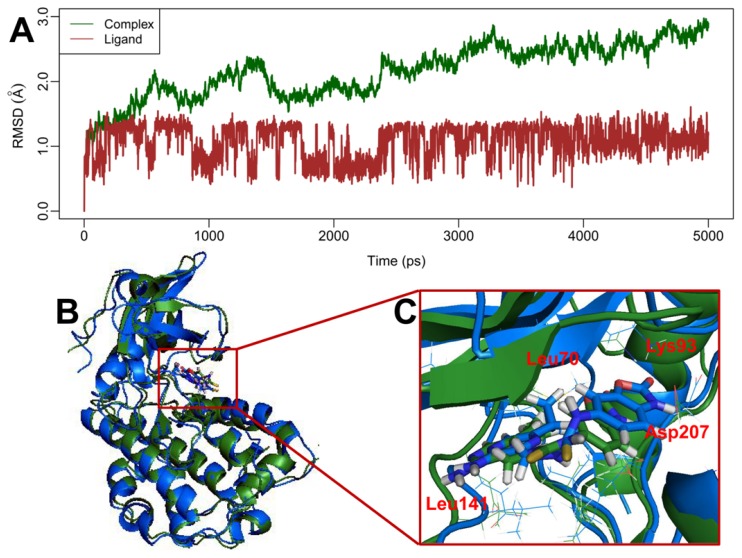
Figure 7.
(A) Plot of the root-mean-square deviation of docked complex/ligand versus the MD simulation time in the MD-simulated structures; (B) Distant view of superimposed backbone atoms of the time-averaged structure from the final 2 ns of MD simulations (colored in forest green) and the initial structure (colored in blue) for compound 70 with MK-2; (C) Nearby view the alignment at the active center of MK-2.

