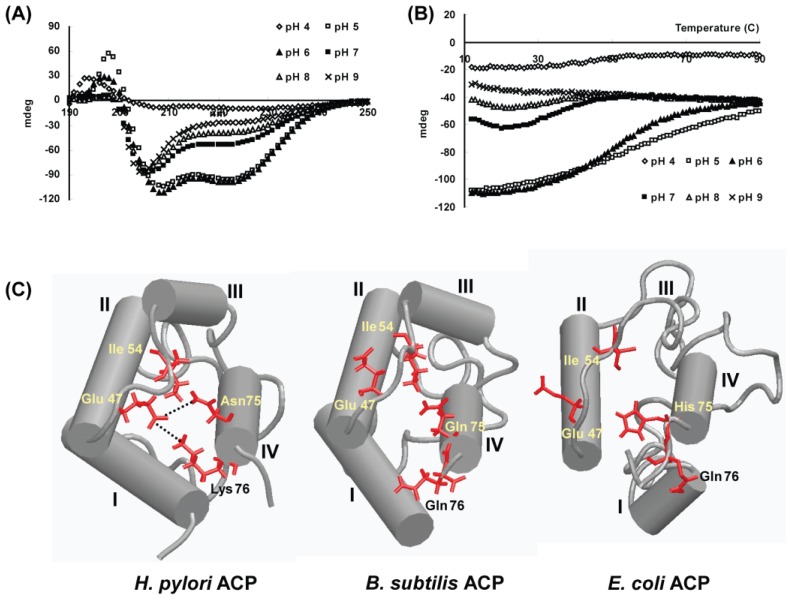
Figure 9.
Comparison of the H. pylori ACP structure with the B. subtilis ACP and E. coli ACP structures. (A) CD spectra of HpACP recorded at various pHs. At neutral and alkaline pH, the conformational transition of HpACP occurred; (B) Tm curves of HpACP. At acidic pH 6, the temperature curves of the HpACP showed a distinct melting temperature around 50 °C. The unfolding process above neutral pH proceeded through multi-phasic changes, showing at least three stages exist; (C) Schematic representation showing the buried hydrophilic residues Glu 47, Asn 75 and Lys 76 in the energy minimized average structure of HpACP. Putative hydrogen-bonding interactions are indicated by dotted lines. The corresponding residues are compared to those of B. subtilis ACP and E. coli ACP.

