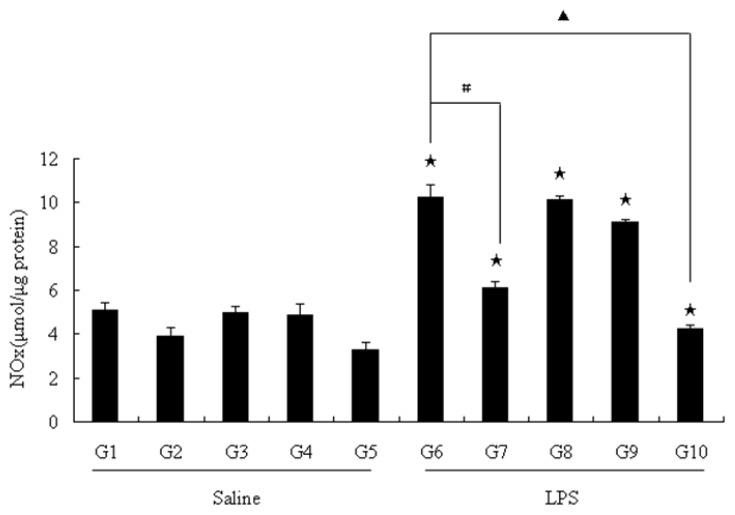
Figure 2.
NOx productions in rat liver. NO level in rat liver was determined by measuring total NOx in the liver homogenates. The results were expressed as percentage of control and were represented by mean ± SE determined from three independent experiments. All p values were for comparisons between control groups and experiment groups. ★ indicated p < 0.05 of each LPS-treated group with one kind of drink versus its saline-treated group as control respectively. # or ▲ indicated p < 0.05 between G6 and one of other groups that were treated with LPS. LPS, lipopolysaccharides; NOx, nitrite/nitrate. Details about groups are mentioned in Materials and Methods.

