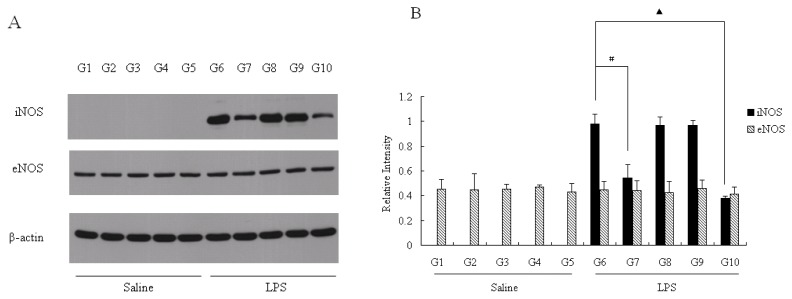
Figure 4.
NOS protein expression in rat liver. (A) The protein expression of iNOS, eNOS and β-actin as control was measured by western blot; (B) The protein level of iNOS and eNOS was quantified versus β-actin as control by using software, Image J. The results were expressed as percentage of control and were represented by mean ± SE determined from three independent experiments. All p values were for comparisons between control groups and experiment groups. # or ▲ indicated p < 0.05 between G6 and one of the other groups that were treated with LPS. LPS, lipopolysaccharides; NOx, nitrite/nitrate. Details about groups are mentioned in Materials and Methods.

