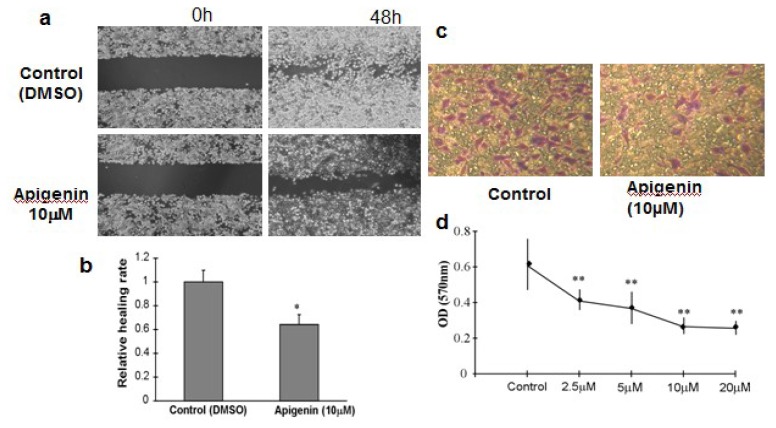
Figure 4.
Cell Migration and Invasion Assay. (a) OVCAR-3 cells were cultured to 90% confluence. A sterile 200 μL pipette tip was used to scratch the cells to form a wound. The cells were then washed with PBS buffer, and cultured in RPMI 1640 medium containing 10% FBS with 10 μM apigenin for 48 h. The cells treated with solvent alone were used as control. The migration of the cells to the wound was visualized with an inverted Olympus phase-contrast microscope. The representative fields were photographed; (b) The relative healing rates were quantified with measurements of the gap sizes after the culture, and normalized to that of control. Three different areas in each assay were chosen to measure the distances of migrating cells to the origin of the wound. The mean values and the standard deviation were obtained from three experiments; (c) The representative images of invasive cells at the bottom of the membrane stained with crystal violet were visualized as shown; (d) The stained cells were eluted by 20% glacial acetic acid for 20 min. The elution was measured at 570 nm to obtain the OD570 values, and normalized to that of control. Each treatment had five replicates. All tests were performed in triplicate and presented as mean ± SD. * indicates significant difference (p < 0.05, One-Way ANOVA).

