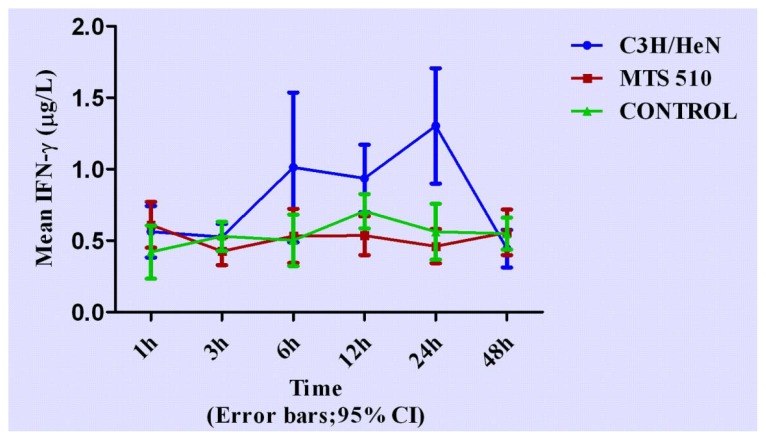
Figure 4.
The expression levels IFN-γ in the three different groups at different time points (expressed as the mean (mg/L) ± SD). Peritoneal macrophages of the three groups are treated with LPS. After stimulation, the concentration of IFN-γ began to rise from 3 h, reaching peak concentration at 24 h and returned to its original level after 24 h in the C3H/HeN group. The other two groups did not have obvious changes throughout the course.

