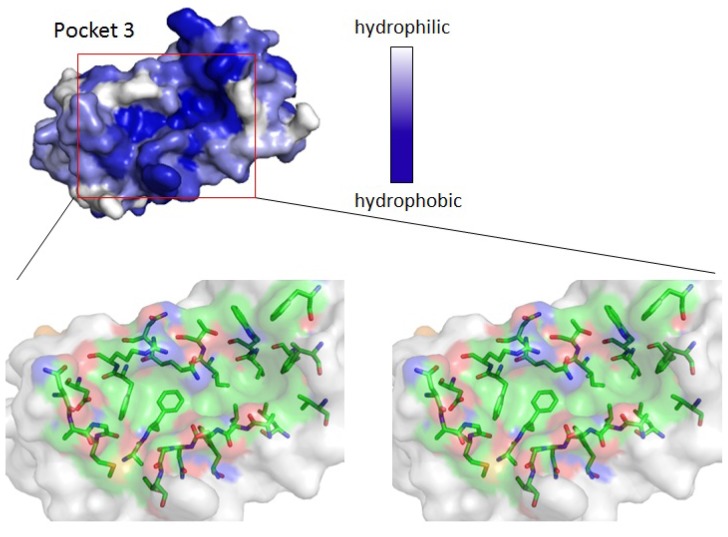
Figure 3.
Stereoview of Pocket 3. Surfaces containing the newly designated Pocket 3, corresponding to the predicted binding sites of ID Nos. 2 and 4, are shown and colored according to a hydrophobicity scale (upper panel). Close-up views in stereo (parallel viewing method) are shown and half-transparent surfaces are merged with stick models (bottom panels) of residues involved in the formation of the predicted binding site. Elements are colored only for Pocket 3: carbon, green; oxygen, red; nitrogen, blue; sulfur, orange.

