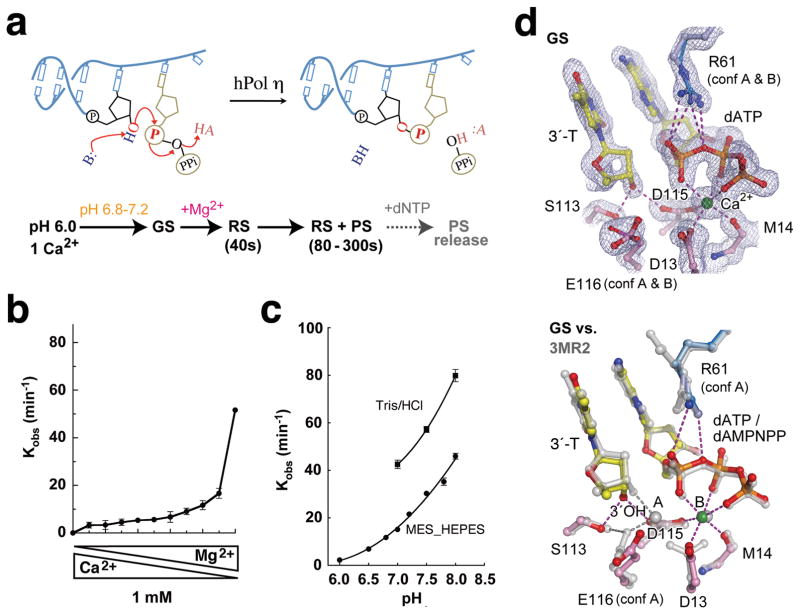
Fig 1.
pH and metal ion dependence of hPol η. (a) Diagrams of DNA synthesis and the procedure of the in crystallo reaction. AH and B stands for general acid and base, respectively. (b) Reaction rate (kobs) is plotted against mixed Mg2+ and Ca2+ at the total of 1mM. (c) The pH and buffer dependent reaction rates. (d) The GS structure. The active site is superimposed with the 2Fo-Fc electron density contoured at 1.2σ (upper panel) or with the non-reactive dAMPNPP ternary complex (PDB: 3MR2, silver, lower panel). Hydrogen bonds and metal ion coordination are shown as dashed lines.

