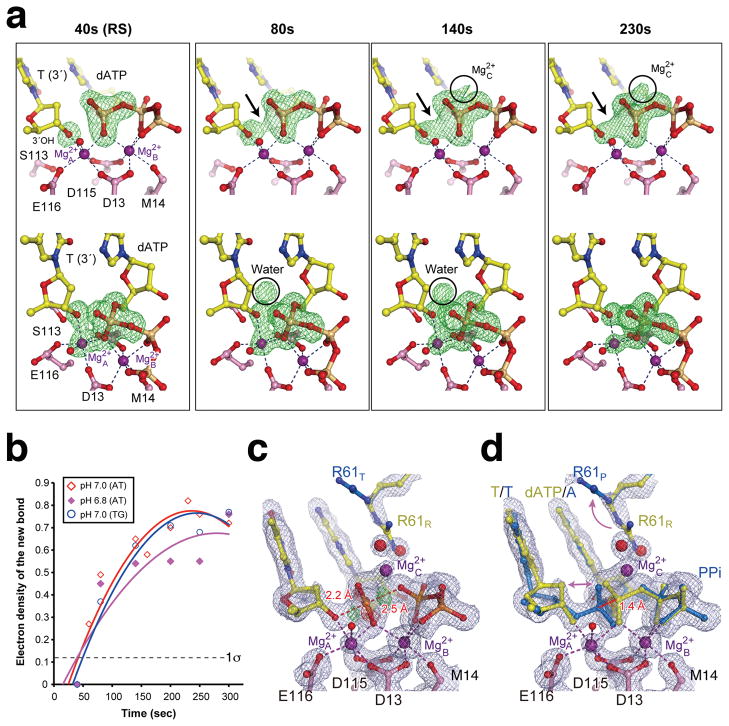
Fig. 2.
Reaction time course. (a) Two views (upper and lower panels) of omit Fo40-230s - Fc40s maps (4.0σ) superimposed onto the 40s structure (pH 7.0). The emerging densities are pointed out or circled. (b) A plot of the absolute peak height of the new bond density versus reaction time at pH 6.8 and 7.0 in AT and TG crystals (Supplementary Table 1a,b). The noise level (1σ) is indicated. (c) The 230s structure refined as the pentacovalent transition state (TS), or (d) the RS (yellow) and PS (blue) mixture. The 2Fo-Fc (1σ, grey) and Fo-Fc map (±3.0σ green and red) are superimposed.

