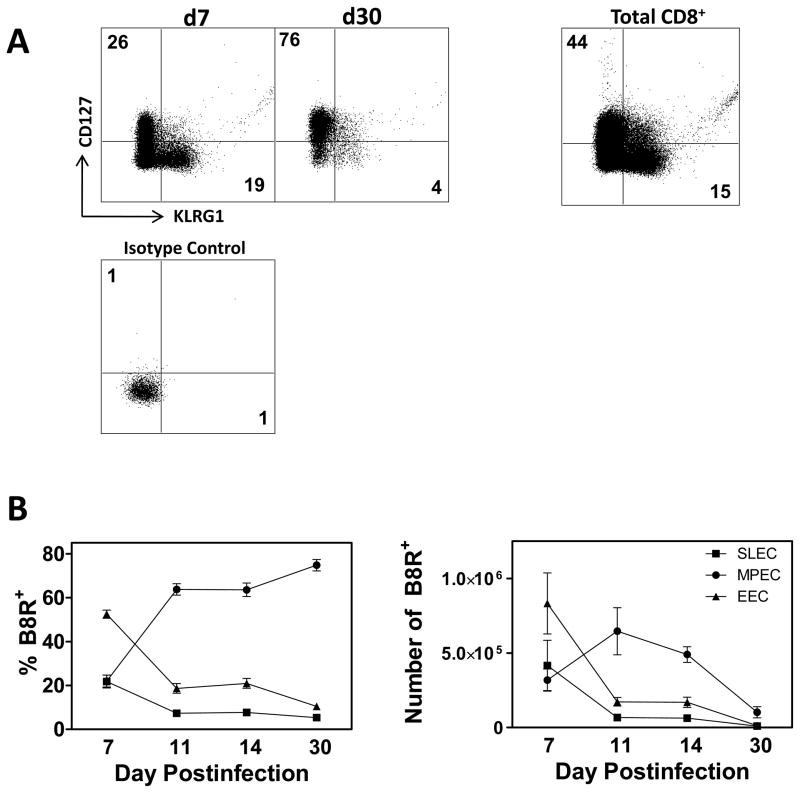
Figure 1. SLEC undergo rapid contraction after the peak of the CD8+ T cell response.
C57Bl/6 mice were infected with 1×10⁶ PFU of VACV and analyzed on d7, 11, 14, and 30 p.i. Infections were staggered to allow for analysis on the same day. Cells are pre-gated on CD8+CD44+ cells. (A) Representative plots showing the frequency of B8R tetramer+ cells that express either CD127 (MPEC) or KLRG1 (SLEC). KLRG1+ and CD127+ staining on the total CD8+ population is shown for comparison. (B) Frequency (left panel) and number (right panel) of B8R tetramer+ CD8+ T cells that are MPEC (CD127+), SLEC (KLRG1+), or EEC (double negative). All data are a mean and SEM of at least 6 mice/group from at least 2 independent experiments.

