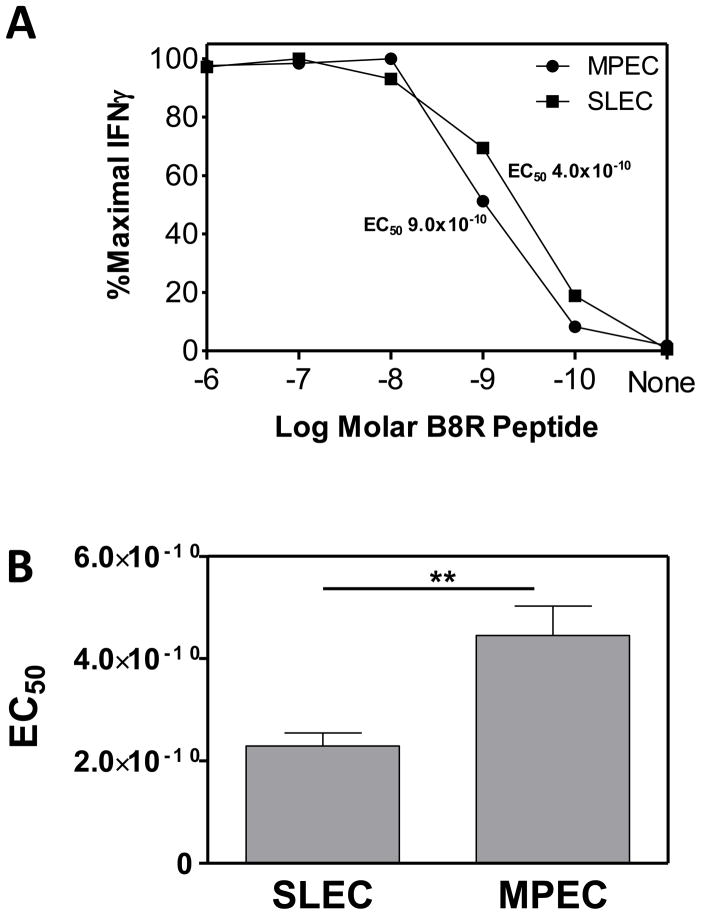
Figure 3. MPEC and SLEC differ in functional avidity on d7 p.i.
C57Bl/6 mice were infected with 1×10⁶ PFU of VACV and on d7 p.i. avidity was assessed by stimulation with titrated concentrations of B8R peptide. IFNγ production was determined by ICCS. Data from a representative mouse are shown in (A). (B) Average EC50 for MPEC vs. SLEC (n=31). The EC50 represents the amount of peptide needed to achieve the 50% maximal percentage of IFNγ producing cells. **, p≤0.01.

