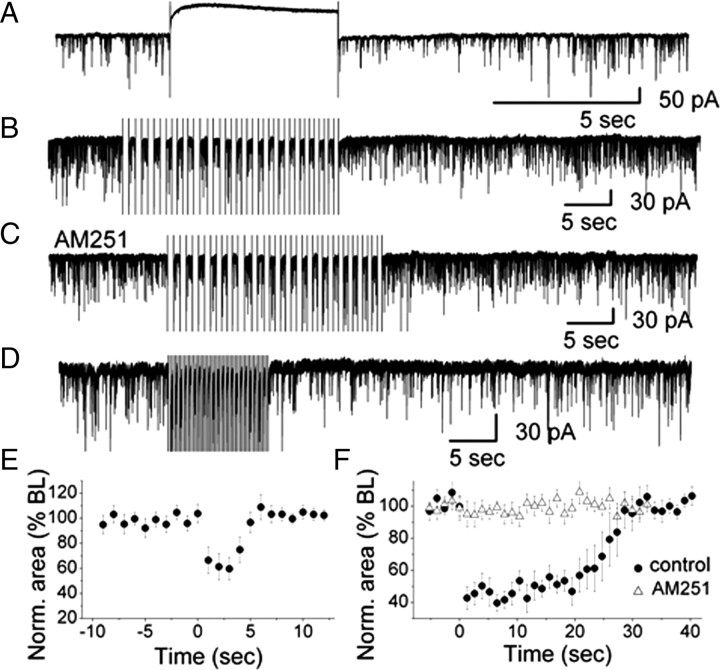
Figure 3.
DSI in olfactory glomeruli. A, A depolarizing voltage step evoked DSI in a representative ET cell. High Cl−-based pipette solution was used for recording sIPSCs. Depolarization was achieved by stepping from −60 mV holding potential to 0 mV for 5 s. B, In the presence of CNQX and 5-AP, a train of 20 voltage steps to 0 mV (0.75 Hz; step duration: 667 ms) transiently reduced sIPSCs in an ET cell. Holding potential was −60 mV. C, In the presence of AM251, no sIPSC suppression was observed. D, A train of 20 voltage steps to −30 mV (2 Hz; step duration: 250 ms) transiently reduced sIPSCs in an ET cell (in CNQX and AP5). E, Normalized sIPSCs area illustrating the magnitude and time course of DSI elicited by a 5 s depolarizing pulse (n = 7). The averaged values between 0 and 5 s after the end of the voltage step were significantly different from the baseline (ANOVA and Bonferroni post hoc analysis, p < 0.05). F, Normalized sIPSC area illustrating the magnitude and time course of DSI elicited by a train of depolarizations to 0 mV (n = 12) in control and in the presence of AM251 (n = 10). In control conditions, the averaged values between 0 and 25 s after the end of the train of voltage steps were significantly different from the baseline (ANOVA and Bonferroni post hoc analysis, p < 0.05).

