
Fig. 2.
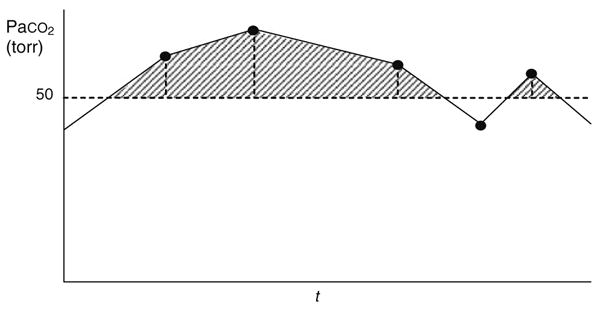
Illustration of longitudinal area under the curve (AUC) computation for Paco2 >50 torr by the trapezoidal rule. Data points for Paco2 are connected by straight lines, and the area under the curve but above PaCO2 = 50 torr is accumulated as the sum of the series of shaded trapezoidal and triangular areas. Thus the AUC for PaCO2 >50 torr provides a measure of the cumulative burden of PaCO2 exceeding 50 torr