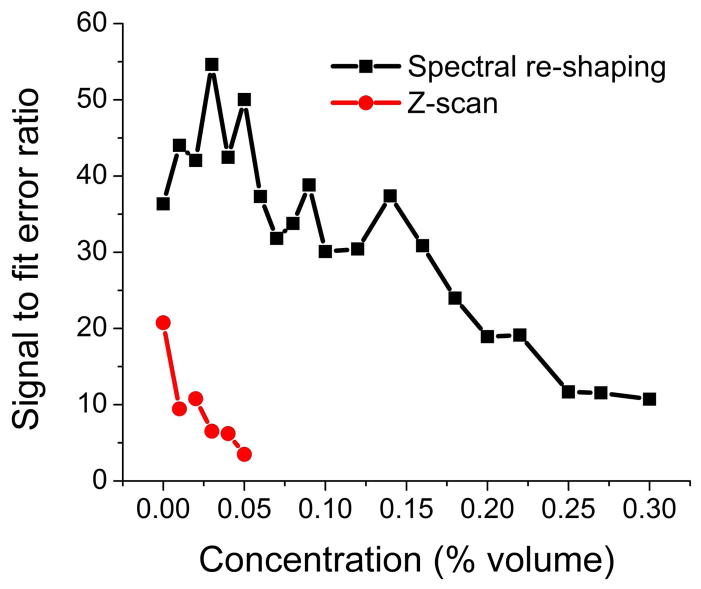
Fig. 4.
Ratio of best fit values for the nonlinear coefficient to the fit error (standard deviation) for the spectral re-shaping and Z-scan technique as a function of concentration of the intralipid solution. The fit was performed on a 9-trace average. Note that the incident power used for the Z-scan was about three times higher than the power used for the spectral re-shaping technique.

