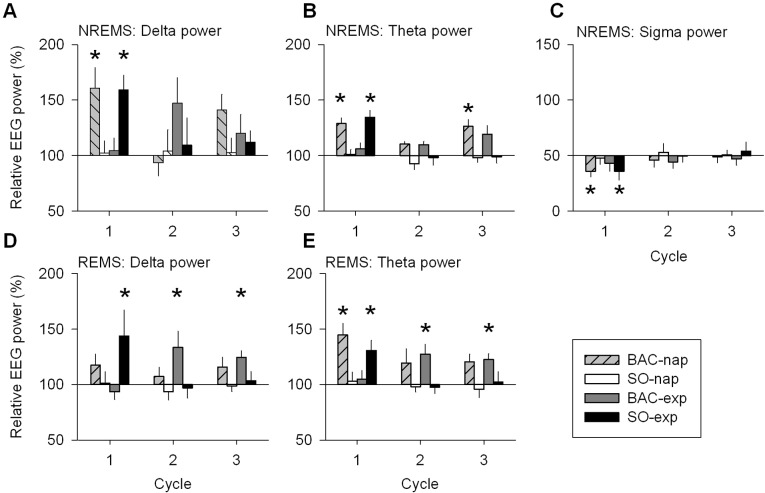
Figure 6.
EEG delta, theta, and sigma power in NREMS and EEG delta and theta power in REMS during the first three sleep cycles: drug treatment conditions vs. placebo. Relative EEG delta (0.75-4.5 Hz), theta (4.75-8 Hz), and sigma (12-15 Hz) power (mean ± SEM; n = 12) correspond to the EXP/BLN night ratio of each drug treatment condition expressed as a percentage of the EXP/BLN night ratio of the PL condition in the 3 first cycles of nighttime sleep. This illustrates the difference between each drug treatment condition and the PL condition for specific frequency ranges. (A, B, C) Only in the 1st cycle, the BAC-nap and SO-exp conditions showed increased relative delta and theta power and decreased relative sigma power compared to the PL condition, except for the BAC-exp condition which showed a significant increase of theta power in the 3rd cycle (1-way mixed-model ANOVA by cycle for factor “treatment” P < 0.05; Dunnett-Hsu test [control = PL] P < 0.05: star). (D) In REMS, compared to the PL condition, relative delta power for the SO-exp condition increased during the 1st cycle, while it increased for the BAC-exp condition during the 2nd cycle and 3rd cycle (one-way mixed-model ANOVA by cycle for factor “treatment” P < 0.05; Dunnett-Hsu test [control = PL] P < 0.05: star). (E) Relative theta power in REMS increased for the BAC-nap and SO-exp conditions during the 1st cycle and increased for the BAC-exp condition during the 2nd and 3rd cycles (for statistical tests see D).

