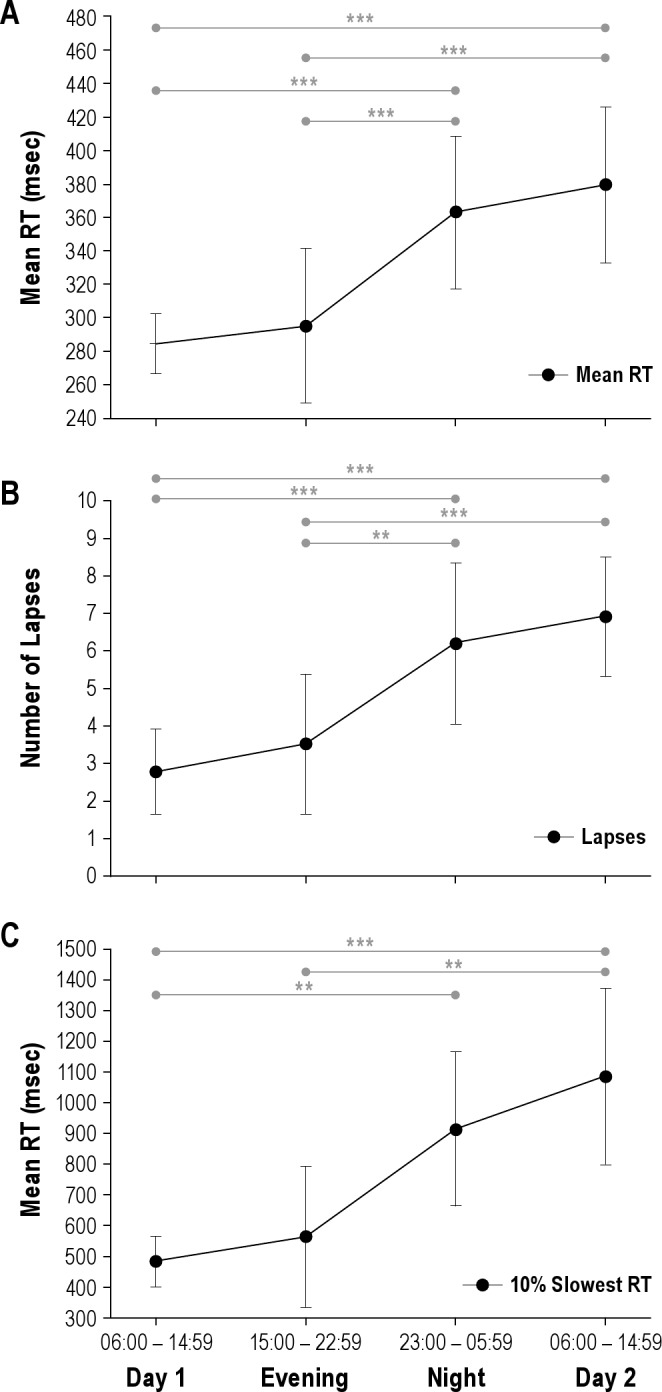
Figure 3.

Mean change in mean PVT reaction time (RT) (A), lapses (B), and slowest 10% RTs (C) over the duration of an extended shift. Post hoc differences are shown (***P < 0.0005; **P < 0.001; *P < 0.005).Mean ± standard error of the mean reported, n=33.
