
Figure 4.
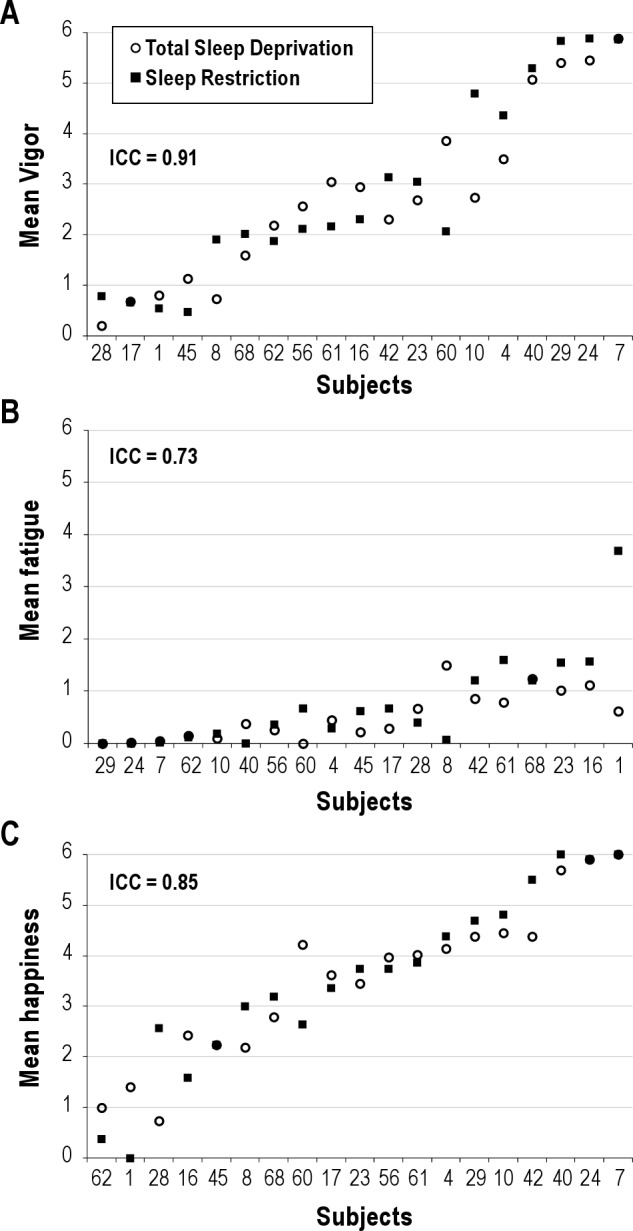
Responses to Total Sleep Deprivation (TSD; solid black squares) and Sleep Restriction (SR; open circles), calculated as the average of the last 12 h of sleep deprivation and the last 12 h of sleep restriction Day 7 for mood variables (A) vigor, (B) fatigue, (C) happiness. Volunteers are indicated by randomly assigned numbers and rank order of volunteers on the x-axis was determined by ranking of the average of the responses to TSD and SR. ICC values are indicated in italics at the top of each graph.