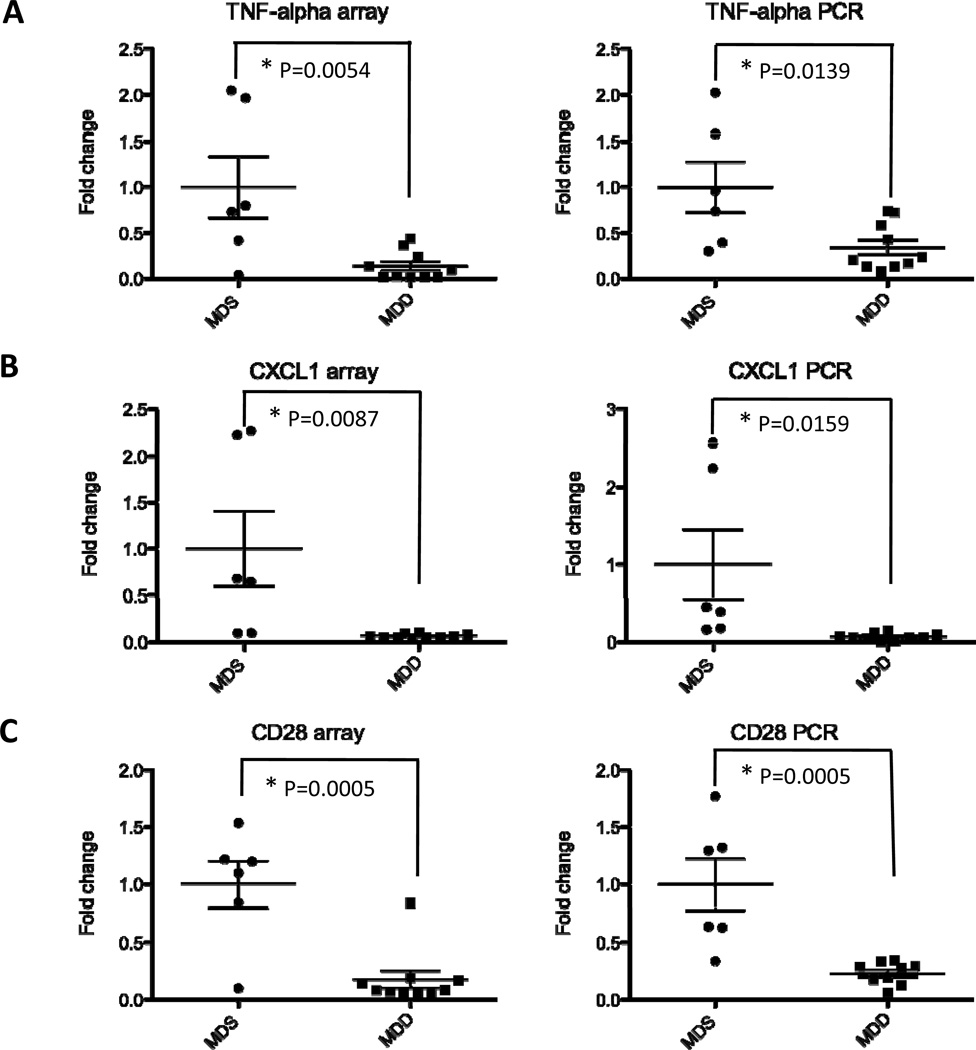
Figure 8. Validation of gene expression changes induced by the MDD diet in ApcMin/+ colons.
Total RNA was isolated from the colons of ApcMin/+ mice as described under Materials and Methods. To validate the array data obtained from Groups I and II, real-time PCR analysis was performed on three of the most significantly down-regulated genes within the pro-inflammatory network, including TNF-alpha (A), CXCL1 (B) and CD28 (C). Each data point represents the expression fold-change value for an individual mouse, with P values as indicated in the Figure. The left panels show the microarray data and the right panels show the qRT-PCR data.

