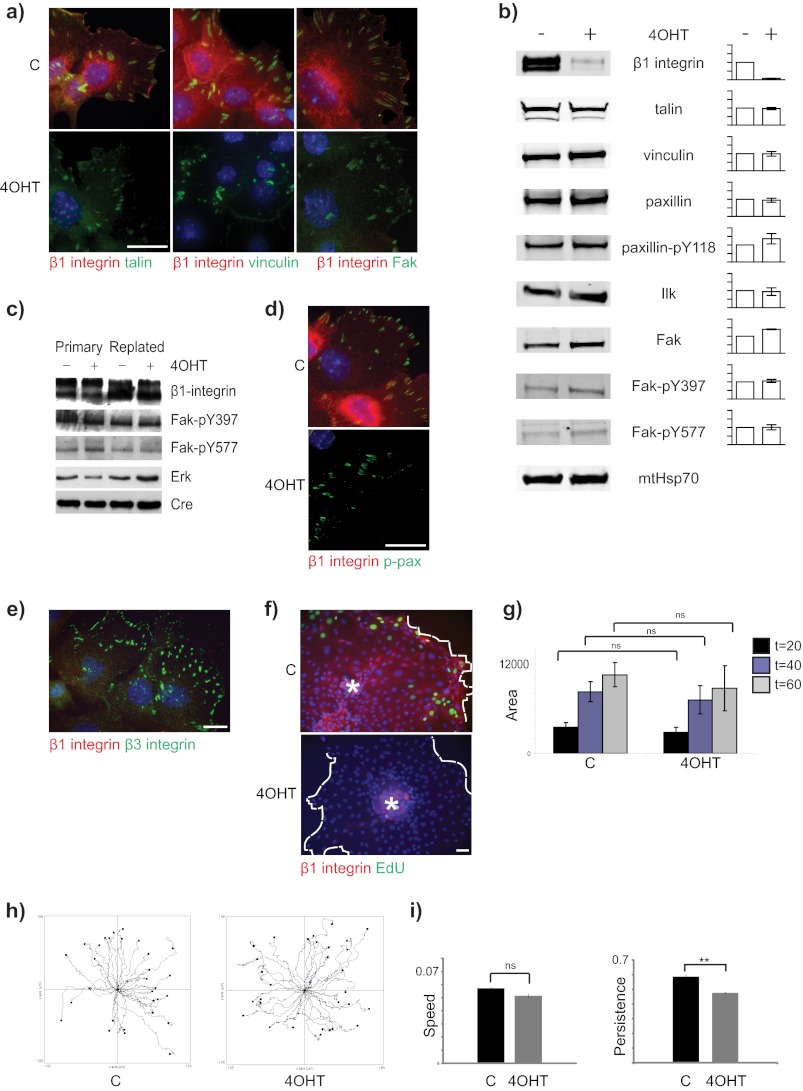
FIGURE 3.
β1-Integrin-null MECs contain functional adhesomes and show collective two-dimensional cell migration. a, β1fx/fx;CreERTM MECs treated with 4OHT or untreated controls (C) were cultured on collagen-I coated coverslips, fixed 3 days after isolation, and stained for β1-integrin (red) and talin, vinculin, or Fak (green). Bar: 20 μm. b, immunoblotting of lysates from untreated and β1-integrin-deleted (4OHT) MECs cultured for 3 days and probed for the indicated antigens. Mitochondrial Hsp70 (mtHsp70) was used a loading control. The intensity of the bands was quantified using the Odyssey system, and the level of signal in the 4OHT-treated samples is plotted relative to untreated. Error bars = S.E. c, immunoblotting of lysates from CreERTM-only MECs replated onto collagen I. d, immunofluorescence staining of paxillin-Tyr(P)-31 (p-pax) in control and 4OHT-treated MECs. Bar: 20 μm. e, β1-null MECs stained with β1- and β3-integrin antibodies. Bar: 20 μm. f, control (C) and β1-null (4OHT) acini were plated onto two-dimensional collagen I-coated plates. The acini were allowed to attach, and the cells migrated onto the culture surface. At the end of the experiment, the cells were stained for EdU and β1-integrin. Note the absence of EdU incorporation in the β1-null cells. Asterisks indicate location of acini from which the cells emigrated. White dotted line indicates migration front. Bar: 40 μm. g, acini were treated with 10 μm mitomycin C for 30 min and prior to cell migration onto the dishes. The area spread was calculated using ImageJ and was not significantly different (ns) in the controls (C) and β1-integrin-null (4OHT) MECs. h, MECs as in g were imaged by time-lapse cinematography, and the tracks of individual cells were followed using MTrackJ. i, the average speed (μm/min) and directional persistence of cell movements shown in h. **, p < 0.01.

