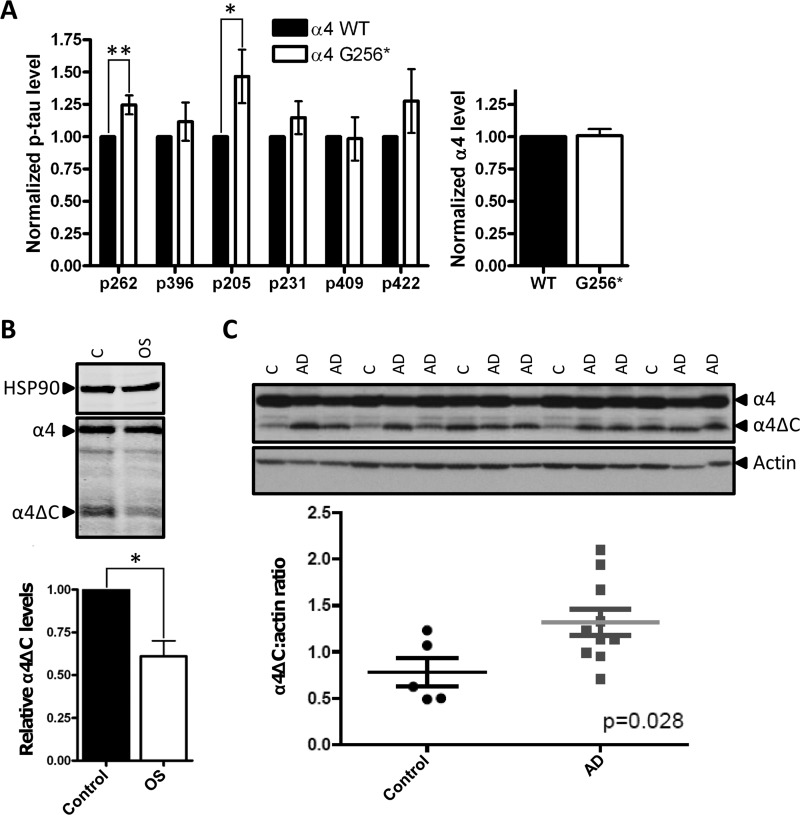
FIGURE 5.
Cleaved α4 increases Tau phosphorylation and is altered in OS and AD. A, HEK/Tau cells expressing HA3-PP2Ac and either wild type FLAG-α4 (α4 WT) or FLAG-α4 Gly256* (α4-G256*) were fixed in a 96-well plate and subjected to in-cell Western blotting using antibodies recognizing the FLAG epitope, HSP90, total Tau, or the indicated phospho-Tau epitope. The phospho-Tau signal was normalized to the total Tau signal in each well, and the normalized phospho-Tau values in α4 Gly256*-expressing cells were compared with the corresponding values in α4 WT-expressing cells, which were set at 1. Likewise, the FLAG-α4 signal was normalized to the HSP90, and the normalized α4 values in Gly256*-expressing cells were compared with corresponding values in α4 WT-expressing cells, which were set at 1. Values represent means ± S.E. *, p < 0.05, **, p < 0.01. B, lysates from Opitz syndrome-derived HEFs and aged-matched control HEFs were analyzed by Western blotting using antibodies recognizing HSP90, α4, and PP2Ac. The graph depicts the relative α4ΔC levels (ratio of α4ΔC signal to total α4 signal (α4ΔC + full-length α4)) in the two cell types with the relative α4ΔC levels in control HEFs set at 1. Values represent means ± S.E. *, p < 0.001 from three independent experiments using the two cell lines. C, trios of age-matched AD cases (n = 10) and control patients (n = 5) post-mortem temporal cortex tissue samples were analyzed by Western for full-length α4 and α4ΔC levels as described above. Samples are loaded in order of descending age. AD represents an Alzheimer disease case, C is a normal control case. Quantification of α4ΔC levels were carried out using Adobe Photoshop analysis functions and normalized to actin levels. Mean α4ΔC/actin ratios are 1.3 ± 0.14 for AD cases and 0.78 ± 0.15 for controls. Depicted error represents S.E. The difference between AD cases and controls is statistically significant; p = 0.028.

