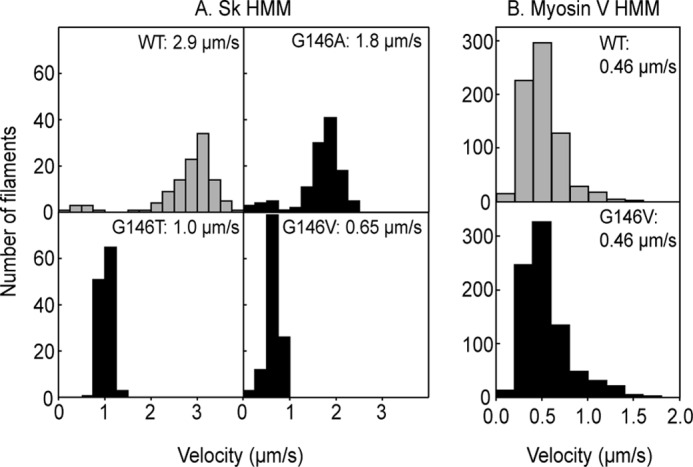
FIGURE 1.

Distributions of gliding velocities of WT and G146 mutant actin filaments on sk HMM surfaces at 24 °C (A) and on myosin V HMM surfaces at 23 °C (B). Histograms indicate the velocity distributions for WT and Gly-146 mutant actin filaments, respectively. The numbers are the averages.
