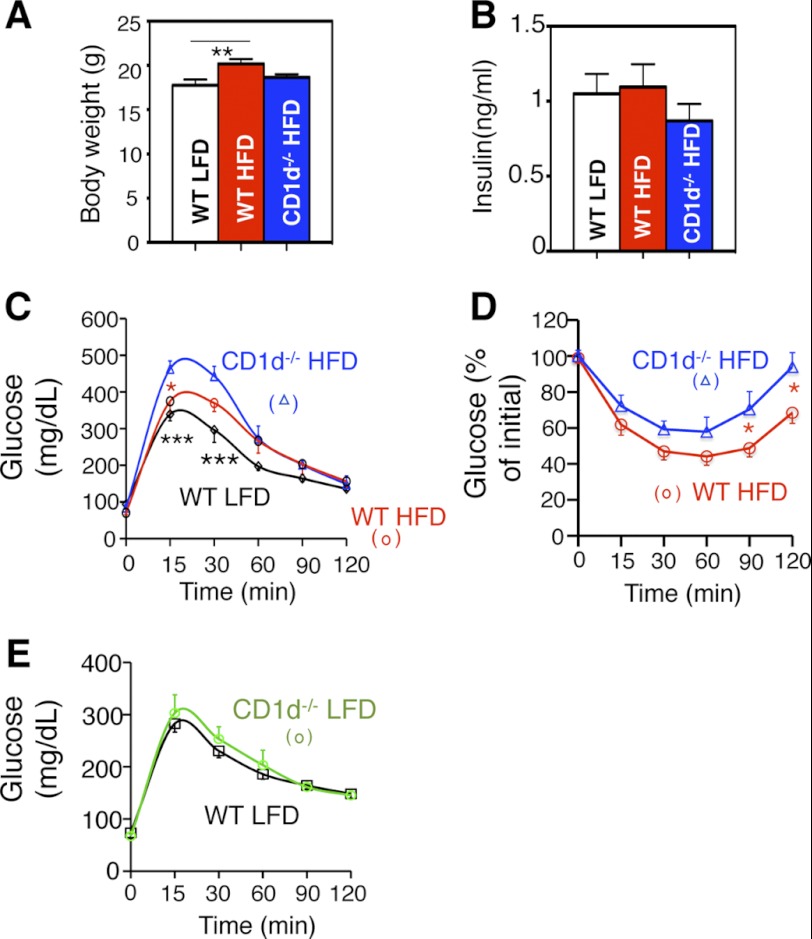
FIGURE 4.
Metabolic phenotypes of CD1d−/− mice with 4d HFD challenge. A, body weight and B, serum insulin level of three cohorts with LFD or 4d HFD feeding followed by a 6 h fasting. n = 8–10 mice per group, two repeats. C and D, GTT and ITT of 4d HFD cohorts. * refers to the p values comparing CD1d−/− HFD to other groups (color-coded). n = 8–10 mice each group, 2 repeats. E, GTT of 7-week-old WT and CD1d−/− mice on LFD. n = 10 mice each, two repeats. Values represent mean ± S.E. *, p < 0.05; **, p < 0.01; ***, p < 0.005.

