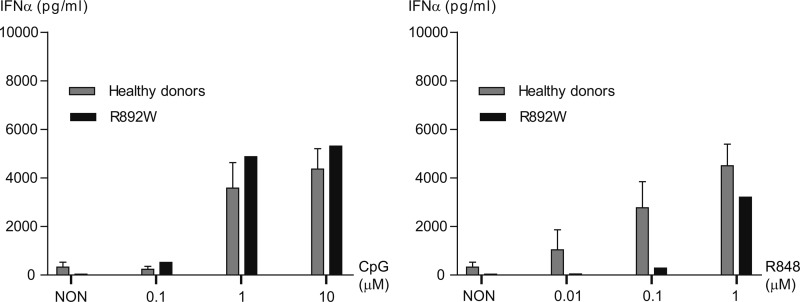
FIGURE 6.
Normal IFNα production from TLR9 R892W primary pDC. Concentration of IFNα measured by ELISA in supernatants from nonstimulated or stimulated BDCA-4-enriched pDC. The cells were enriched from PBMC (see “Experimental Procedures”) and stimulated with a range of either CpG-ODN 2216 (Type A ODN; 0.1, 1, and 10 μm, left panel) or R848 (0.01, 0.1, and 1 μm, right panel) for 48 h. NON, non-stimulated (media only). Duplicates ± standard error of the mean are shown.

