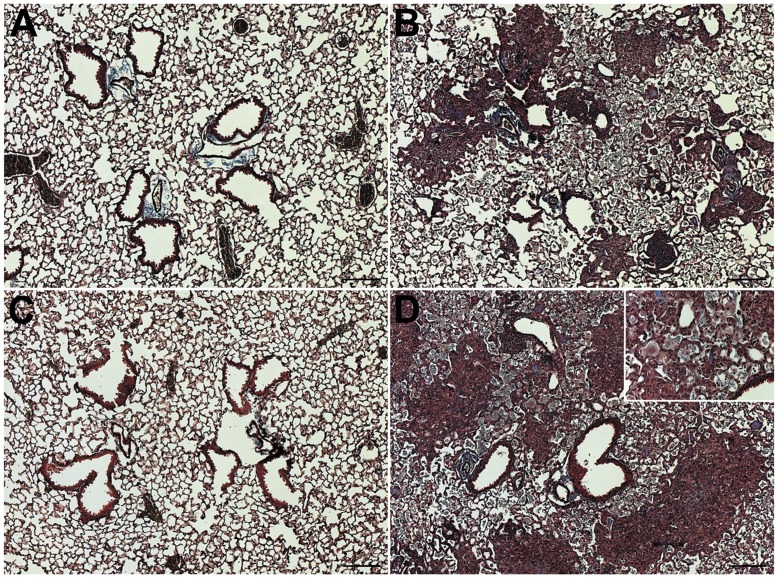
Figure 2. Histology immediately after the end of inhalation challenge.
(A) Saline-Saline; (B) Silica-Saline; (C) Saline-LPS; and (D) Silica-LPS exposed mice immediately after the end of either saline or LPS inhalation challenge. n = 6/group. Images were taken in anatomically comparable regions of the lung at 5× (main images) or 20× (Inset in panel D) magnification. Bar = 100 microns.

