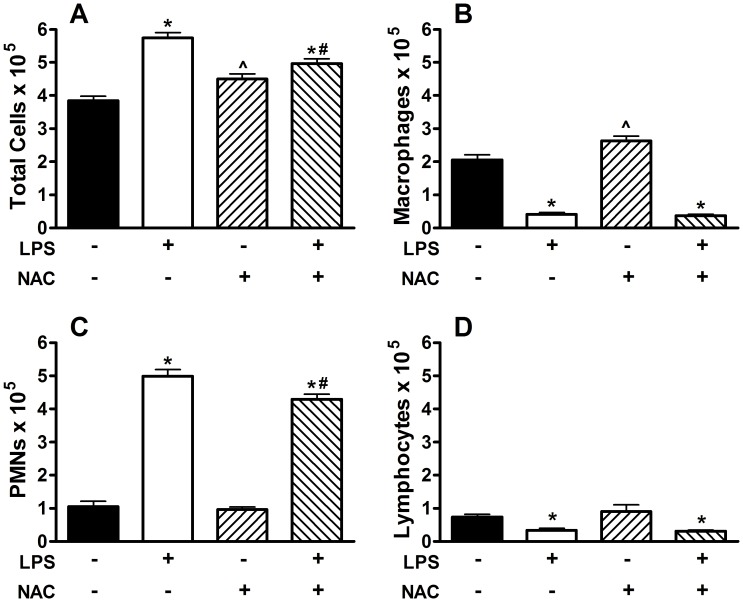
Figure 8. Whole lung lavage immediately after the end of inhalation challenge in mice treated with drinking water alone or drinking water supplemented with 2 mg/ml NAC during LPS exposure.
(A) Total cells×105; (B) total macrophages×105; (C) total neutrophils×105; and (D) total lymphocytes×105. Data are presented as Mean + SEM. n = 8/group. * p<0.05 LPS vs. Saline (significant difference due to inhalation challenge); ∧ p<0.05 vs. regular drinking water (significant difference due to NAC treatment alone); # p<0.05 Silica vs. Saline (significant difference due to silica instillation or combined Silica and LPS).

