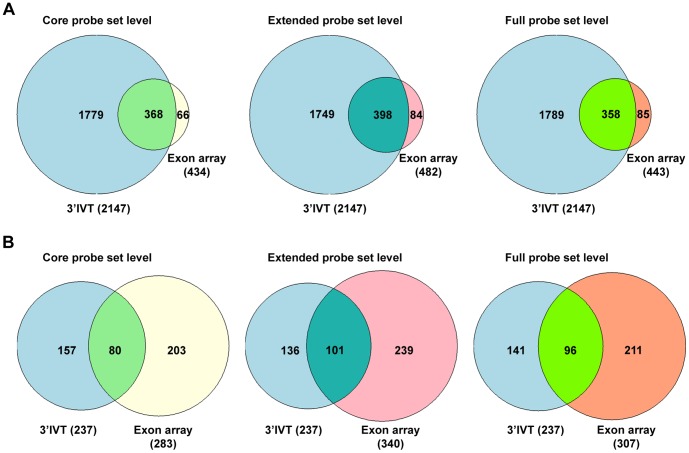
Figure 4. Gene number comparison 3′IVT Array versus exon array for dysplasia versus non-transgenic lung tissue at core, extended and full probeset levels.
A. 3′IVT array analyzed with ArrayTrack software at FDR of 0.05, fold change ≥2, mean channel intensity = 100, bad flag = 5, and exon array analyzed with Biotique XRAY software at p<0.05, fold change ≥2, minimum probesets per genes = 2, minimum probes per probeset = 2. B. 3′IVT array analyzed with ArrayTrack software at FDR of 0.001, Fold change ≥2 and exon array analyzed with Biotique XRAY software at p<0.001, fold change ≥2, minimum probesets per genes = 2, minimum probes per probeset = 2.

