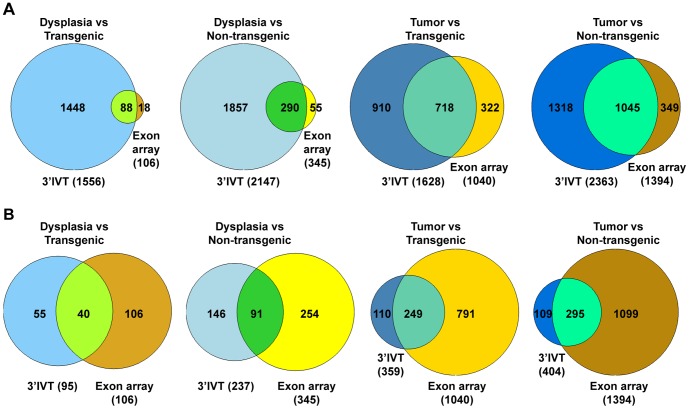
Figure 7. Gene number comparison 3′IVT array versus exon array using ArrayTrack.
Comparison between 3′IVT and exon array shows number of genes in common for comparisons Dysplasia vs Transgenic, Dysplasia vs Non-transgenic, Tumor vs Transgenic and Tumor vs Non-transgenic. For exon array gene expression estimated at core probeset level using expression console and analyzed with ArrayTrack software at FDR of 0.05, fold change ≥2, mean channel intensity = 100, bad flag = 4, compared with 3′IVT array analyzed with ArrayTrack software where in A. 3′IVT analyzed at criteria at FDR of 0.05, fold change ≥2, mean channel intensity = 100, bad flag = 5. B. 3′IVT analyzed criteria at FDR of 0.001, fold change ≥2, mean channel intensity = 100, bad flag = 5.

