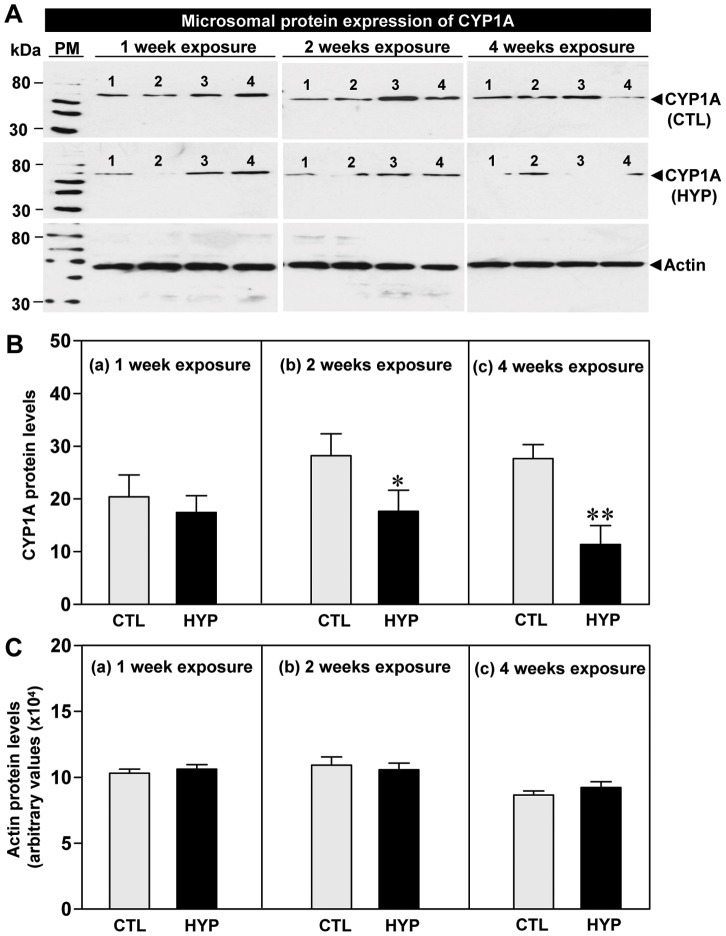
Figure 3. Hypoxia-induced expression of CYP1A protein determined by Western blot analysis.
Effects of 1, 2 and 4 weeks hypoxia (dissolved oxygen, DO: 1.7 mg/L) exposure on CYP1A protein expression (A) and relative protein levels (B), and actin protein levels (C) in croaker liver. Each value represents the mean±S.E.M (N = 8–10, tissues were randomly sampled from individual fish for measurements). Asterisk indicates significant difference from normoxic controls (Student’s t-test, *p<0.05, **p<0.01). Note: exposure duration only refers to period fish were exposed to target DO; fish were previously exposed to declining DO for additional 2-day adjustment period. The positions of Western blot protein standard marker (PM) are indicated on the left. No significant difference was detected in actin protein levels between the treatment groups. CTL, control; HYP, hypoxia.

