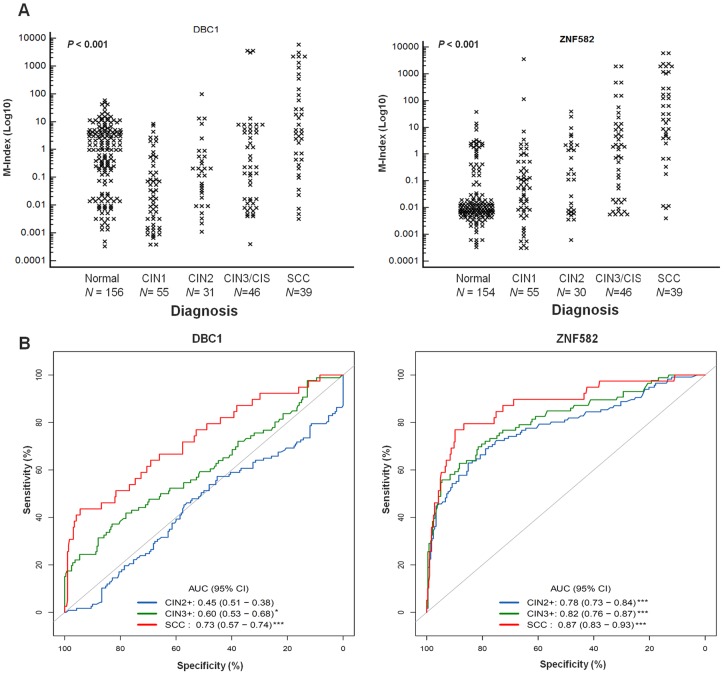
Figure 3. QMSP analysis of DBC1 and ZNF582 in cervical scrapings.
(A) Dot plots illustrate the M-index distributions. N represents the case number. P-value <0.001 was determined by the nonparametric Kruskal–Wallis rank sum test. (B) The areas under the receiver operating curves (AUCs) used to estimate accuracy. (*P-value <0.05, ***P-value <0.001; CI, confidence interval).

