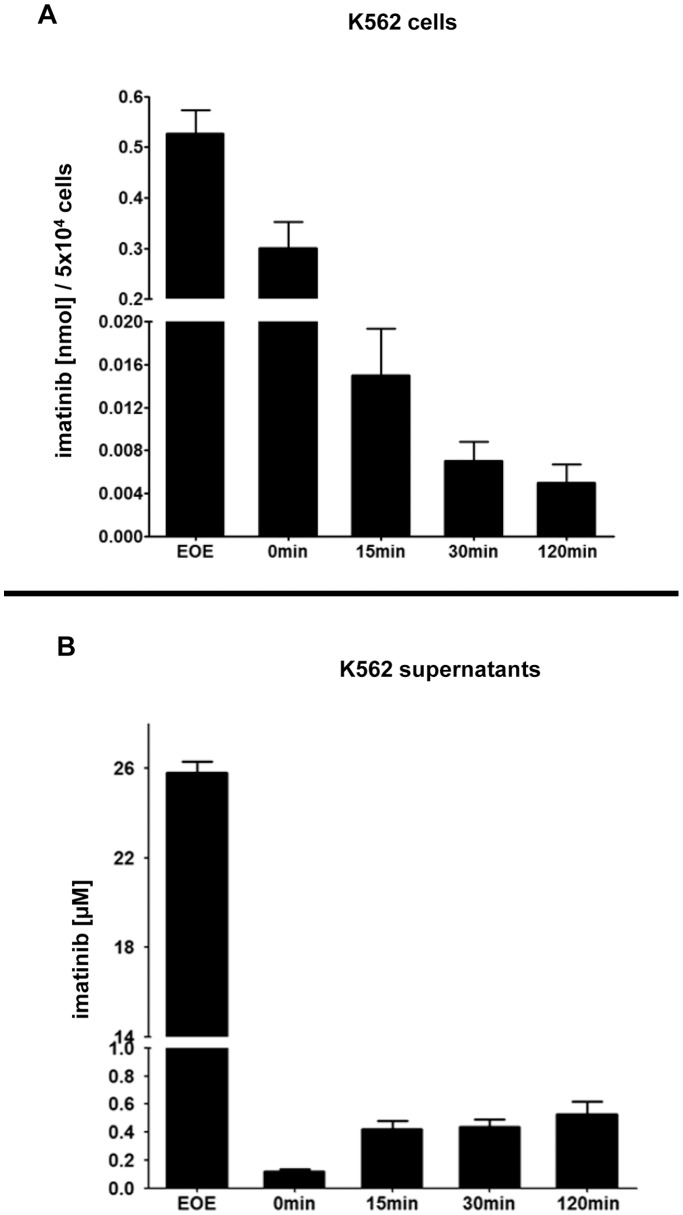
Figure 6. Measurement of cellular imatinib uptake and release upon HD-TKI pulse-exposure.
5×10⁴ K562 cells were treated for 2 h with 25 µM 14C-labeled imatinib in a total volume of 1 ml cell culture media followed by drug wash-out as described for Figure 1B . Specific activity of cell culture supernatants and cell pellets was measured using a scintillation counter. Imatinib concentrations were calculated by fitting the dpm (disintegrations per minute) values to a standard curve. All measurements were performed in triplicate. Depicted are mean values + SEM of 4 independent experiments. (A): Dynamics of cellular imatinib content was measured. Cells were pelleted and washed according to our drug wash-out protocol immediately at the end of the incubation period (end of exposure, “EOE”) and then subjected to scintillation counter assessment of cellular imatinib uptake. In parallel, for analysis of imatinib release, cells were replated in 1 ml fresh cell culture media and 0, 15, 30, and 120 min after replating cells were again pelleted, washed and then subjected to measurement in a scintillation counter. (B): Corresponding dynamics of imatinib concentration in cell culture supernatants upon HD-TKI pulse-exposure followed by drug wash-out. Measurement of cell culture supernatants immediately after 2 h incubation with 25 µM 14C-labeled imatinib represents the amount of imatinib present in the incubation medium (“EOE”). Intervals 0, 15, 30, and 120 min represent the time elapsed after initial drug wash-out and replating in fresh cell culture media.

