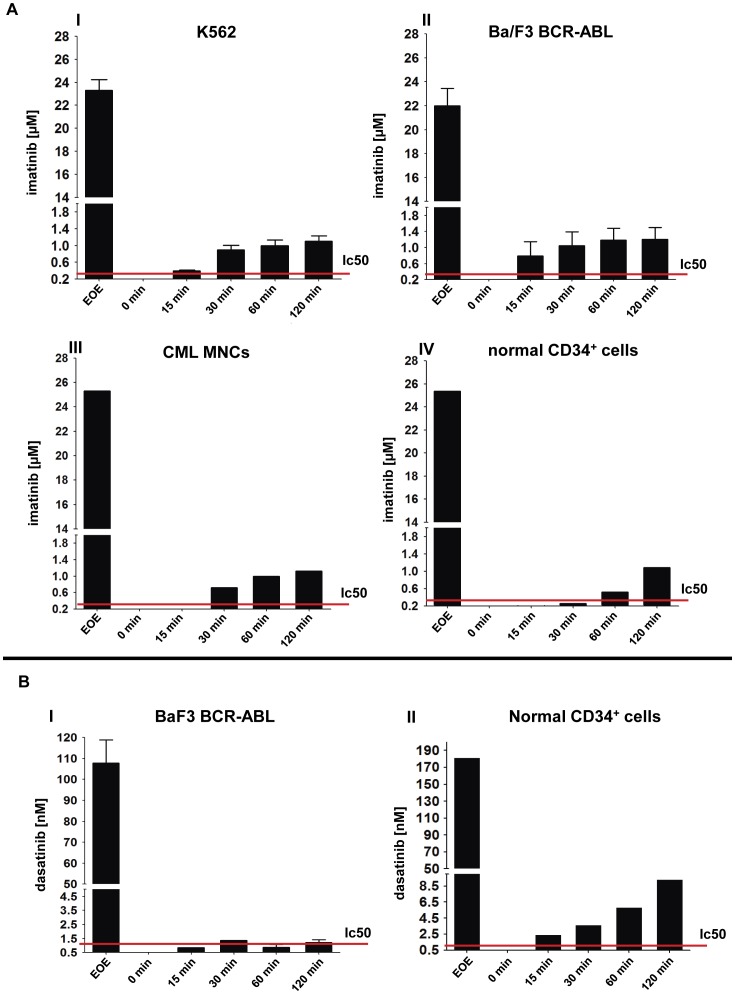
Figure 7. Measurement of TKI concentrations in cell culture supernatants using chromatographic methods.
Imatinib and dasatinib concentrations were measured in cell culture supernatants using HPLC and LC/MS/MS, respectively. The sampling procedure and time-scale were identical to that described in Figure 5 . (A) Ba/F3-BCR-ABL cells (I), K562 cells (II), primary human CML patient MNCs (III) and normal CD34+ enriched cells (IV) were pulse exposed to 25 µM imatinib followed by drug wash-out as described in Figure 1B . (B) Ba/F3-BCR-ABL cells (I) and normal enriched CD34+ cells (II) were pulse exposed to 100 nM dasatinib followed by drug wash-out as described in Figure 1B . The red lines represent the in vitro IC50 for the respective TKI used. Supernatant 1 (“S1”) was measured and served as a positive control. Measurement of cell culture media taken immediately upon replating served as a control for efficient washing (“0 min”). Depicted are mean values + SEM; at least 3 independent experiments were performed. For primary material one representative experiment is shown.

