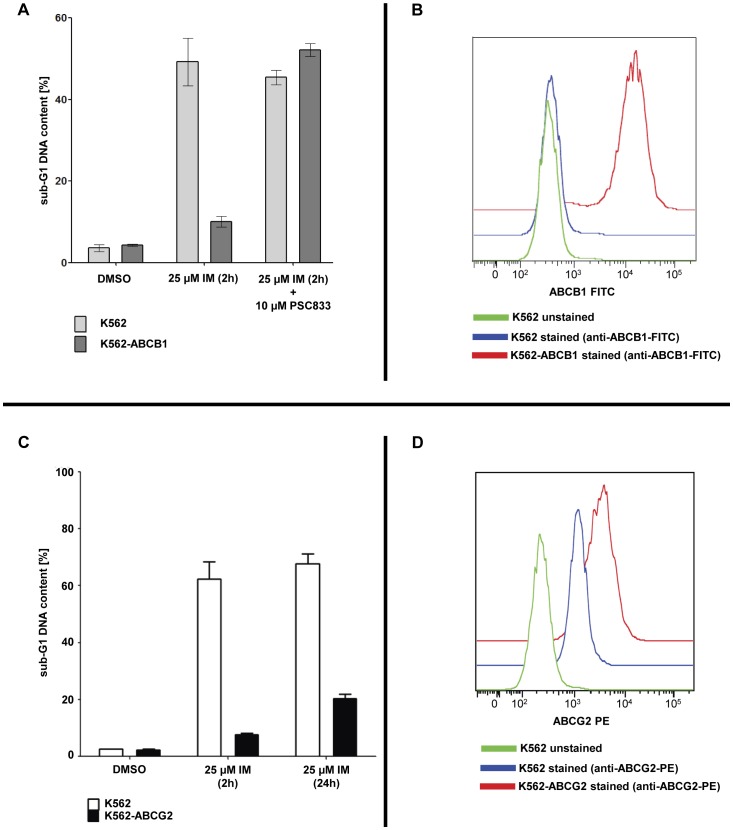
Figure 8. Overexpression of ABC transporters desensitizes K562 cells to high-dose imatinib pulse-exposure.
(A) K562 and K562-ABCB1 cells were treated for 2 h with 25 µM imatinib either in the presence or absence of the ABCB1-inhibitor PSC833 Cells treated with the solvent DMSO served as negative controls. Sub-G1 DNA content analysis was performed 24 h after beginning of TKI exposure. The mean percentage of cells in sub-G1 phase ± SEM is depicted. Experiments were performed in triplicate. (B) K562 and K562-ABCB1 cells were surface stained with a FITC-labeled anti-ABCB1 antibody. Cells were analyzed by flow cytometry using a BD FACS Canto II cytometer. Overlay of measurements was performed using FlowJo Software (Tree Star, Ashland, Oregon, USA). (C) K562 and K562-ABCG2 cells were treated with 25 µM imatinib for 2 h, followed by drug wash-out. Cells were replated in fresh cell culture medium and samples were analyzed after 24 h by flow cytometry after propidium iodide staining. Untreated cells (“DMSO”) and continuously treated cells (“25 µM IM (24 h)”) served as controls. Three independent experiments were performed and the mean percentage of cells in subG1 phase + SEM is shown. (D) K562 and K562-ABCG2 cells were surface stained with a PE-labeled anti-ABCG2 antibody. Cells were analyzed by flow cytometry using a BD FACS Canto II cytometer. Overlay of measurements was performed using FlowJo Software (Tree Star, Ashland, Oregon, USA).

