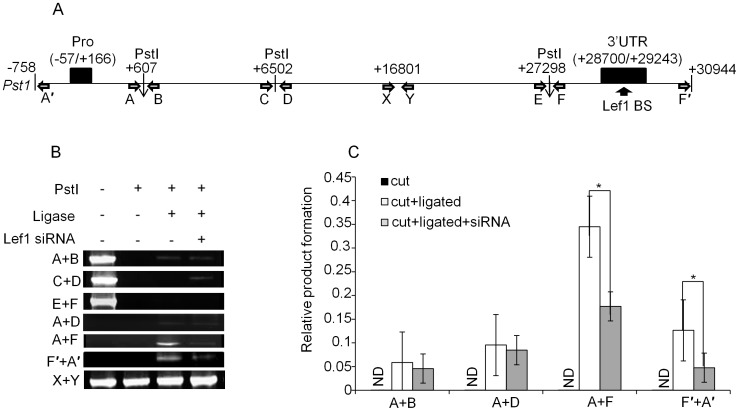
Figure 4. Juxtaposition of 3′ UTR with the promoter through gene looping.
(A) The relative position of the primers and Pst1 cleavage sites designed to detect gene looping between the Col2a1 promoter and 3′ UTR are denoted as described in the main text and Fig. 1A. Figure was not drawn in scale. The filled black boxes indicate the promoter and 3′ UTR. X and Y denote primer pairs that do not flank any Pst1 site. The empty horizontal arrows denote the 3C primers and the vertical black arrow indicates the Lef1 binding site (BS) in the 3′ UTR. (B, C) 3C assay was performed. Nuclei prepared from uncrosslinked (Fig. S2), formaldehyde crosslinked or Lef1 siRNA transfected primary chondrocytes were subjected to Pst1 digestion. Digestion efficiency was confirmed by RT-PCR using primers flanking the Pst1 sites (Fig. S2). The formation of 3C product was detected by qRT-PCR using digested (cut), digested and ligated (cut + ligated) or Lef1 siRNA treated, digested and ligated (cut + ligated + siRNA) DNA samples as templates. The results are shown as EtBr stained gel images (B) or quantitative representation (C) of the product obtained with the indicated primer pairs relative to that obtained with control primer pairs X+Y. The data shown are expressed as mean ± SEM, n = 3 and *P<0.05.

