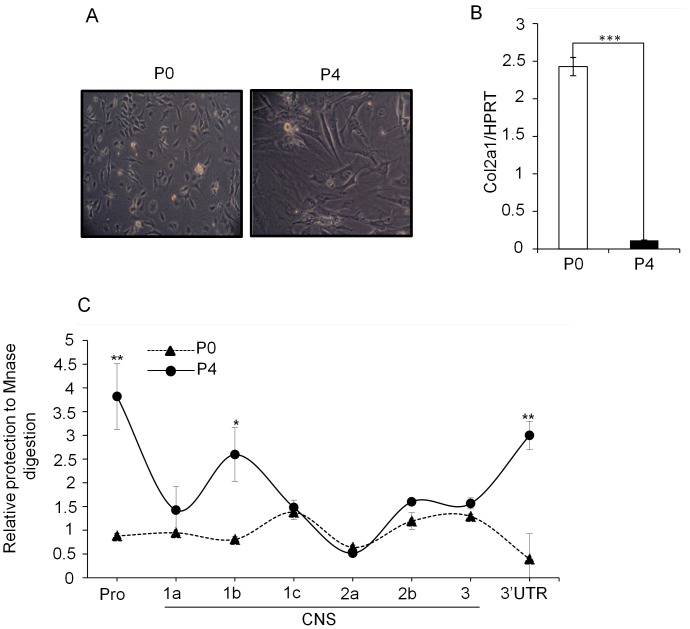
Figure 5. Down-regulation of Col2a1 expression during chondrocyte dedifferentiation.
(A) Primary chondrocytes were isolated from ribs of 4–5 days-old ICR mice and subcultured three more times at 2–3 days intervals to get the terminally differentiated stage (passage P4). Phase contrast images of primary chondrocytes (passage P0) and terminally differentiated passage P4 are represented. (B) Relative level of Col2a1 transcript in the P0 and P4 stage of chondrocytes was detected by qRT-PCR and expressed relative to the level of housekeeping control HPRT. (C) Chromatin accessibility test by CHART-PCR. Nuclei were prepared from P0 and P4 stage cells treated with MNase and genomic DNAs were isolated. 50 ng of genomic DNA from each stage was used to perform qRT-PCR using primer pairs specific for the promoter, CNSs and the 3′ UTR of Col2a1 locus. The relative digestion to MNase was calculated with respect to that of actin promoter primers as described in Materials and Methods section. The data shown are expressed as mean ± SEM, n = 3 and *P<0.05, **P<0.01 and ***P<0.001.

