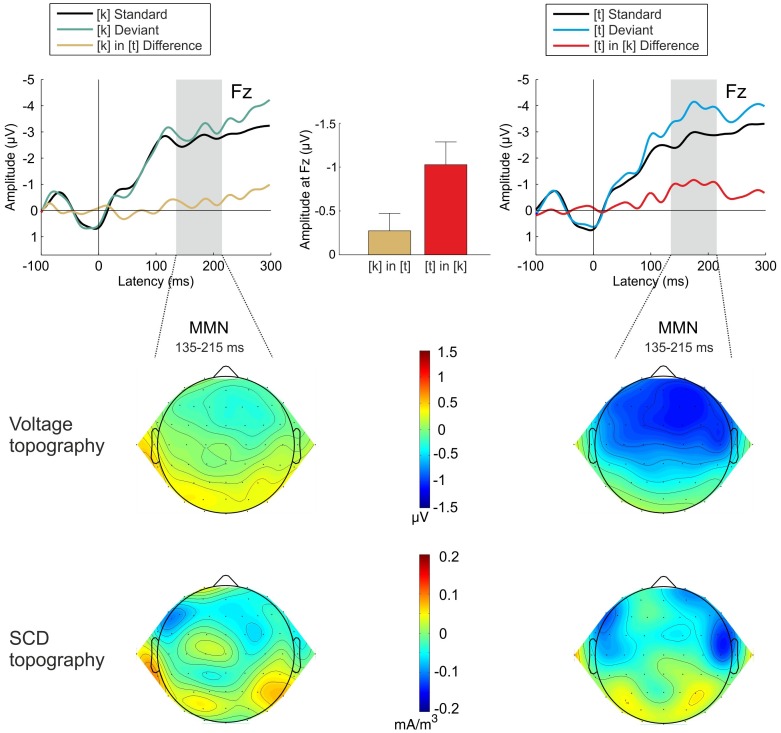
Figure 3. Top row: Grand-average ERPs elicited by standard (black line) and deviant (blue line) [laks] (left panel) and [lats] (right panel) stimuli.
The deviant-minus-standard difference waveforms are given in red. The latency range for measuring the MMN component (135–215 ms) is marked in gray. Mean MMN amplitudes for the two contrasts are given in the top middle panel, error bars indicate standard errors of mean. Middle row: Voltage topographies in the MMN latency range. Bottom row: SCD topographies in the MMN latency range. Smoothing parameter was 10−7 for the voltage distribution and 10−5 for the SCD distribution.

