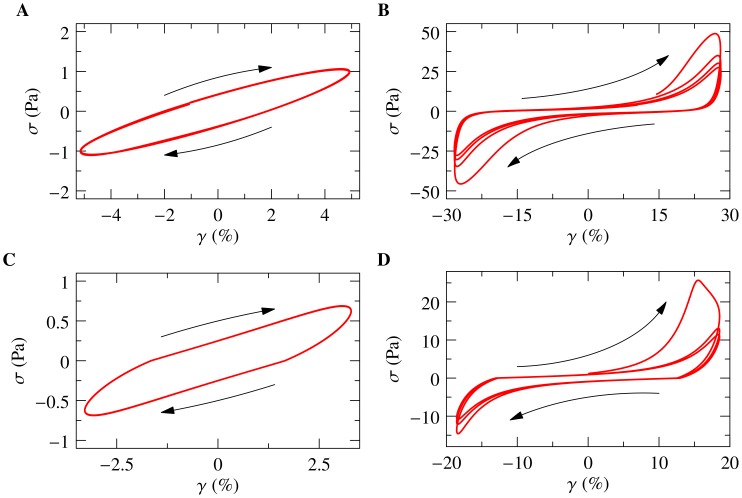
Figure 1. Stress-strain curves for an oscillatory shear strain  .
.
(a, b) Experiment: passive transient F-actin/HMM gels ( mg/ml,
  ) sheared at strain amplitudes of
  and
and  , corresponding to a weakly/strongly non-linear response, respectively. The upward bending of the ellipses signals stiffening, their concave regions near maximum strain imply softening. The softening and the ensuing “shakedown” of the stress-strain curves towards a limit cycle are indicative of inelastic fluidization. (c, d) Corresponding theory curves from the inelastic glassy wormlike chain (i Gwlc) model [25] (parameters
  ,
,  ,
,  ,
,  Hz; single-polymer displacement and force were converted to network strain and stress as described in Methods). The absolute stress and strain scales in theory and experiment are compatible on the present (mean-field) level of modeling, but the theory somewhat overestimates the stiffening during the initial large-amplitude loading cycle, and, as a consequence, also the peak force and the strength of the shakedown.

