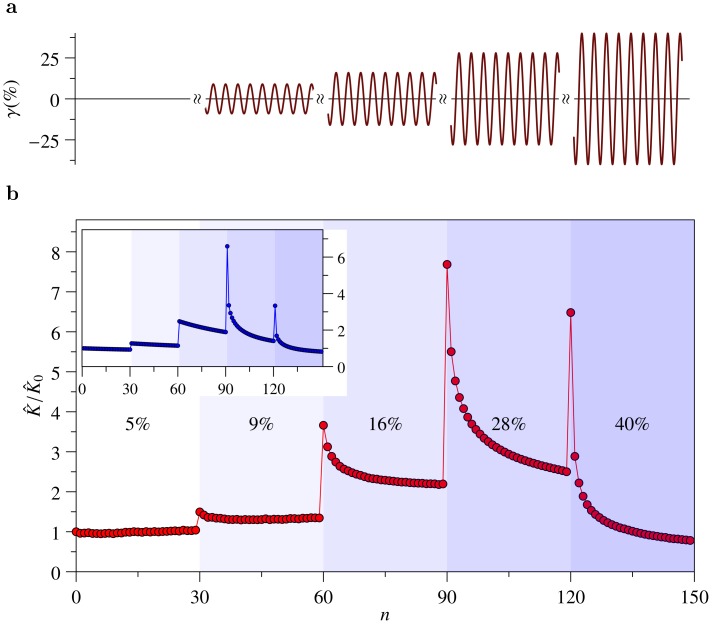
Figure 2. Nonlinear inelastic response of F-actin/HMM networks.
(a) Schematic of the oscillatory driving protocol (the strain amplitude  is increased in steps after every 30 cycles, driving frequency
  Hz). (b) Measured reduced nonlinear modulus
  (peak stress over peak strain) as a function of the cycle number
  . The shaded background indicates the monotonic increase of the strain amplitude
  (indicated in percent). Note that the modulus responds nonmonotonically to both transient and stationary loading, hinting at antagonistic mechanisms with multiple time scales. Inset: Theory curve from the i Gwlc model [25] reproducing the key features, transient and stationary stiffening and softening with the parameters from Fig. 1 (see also Methods and Fig. E in Supporting Information S1).

