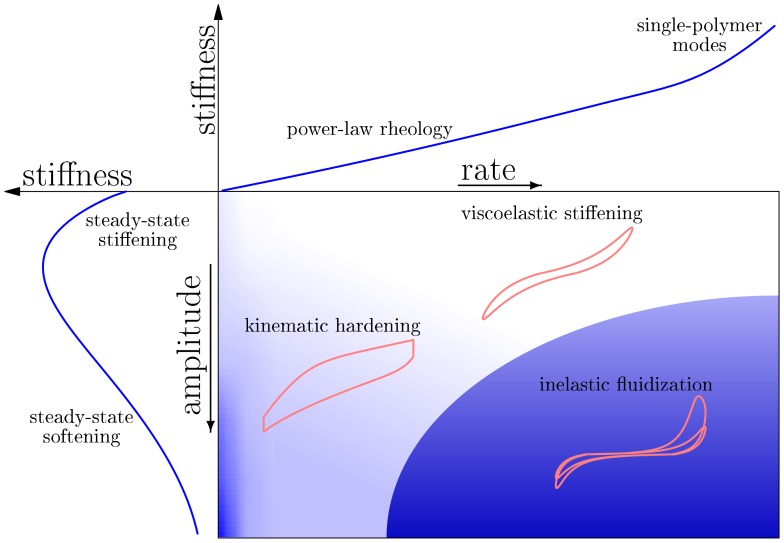
Figure 4. Constitutive diagram for the iGWLC model.
The central panel gives a qualitative graphical summary of the mechanical response predicted by the model as a function of the amplitude and characteristic rate of an imposed deformation pulse. At low amplitudes, in the linear regime, it exhibits power-law rheology (upper panel, log-log scale). At low rates, in the quasistatic regime, it exhibits stiffening at low amplitudes, where entropic stiffening of the polymer backbone dominates, and softening at high amplitudes, where the stiffening is eventually overruled by the exponential bond softening (left panel, linear scale). This mechanism underlies the initially ascending and later descending steps in the nonlinear modulus in Fig. 2. At high rates and high amplitudes, a steep initial stiffening with subsequent fluidization and slow recovery governs the response (central panel). The schematic stress-strain curves for oscillatory driving exemplify the salient features of the nonlinear response in the various parameter regions.

