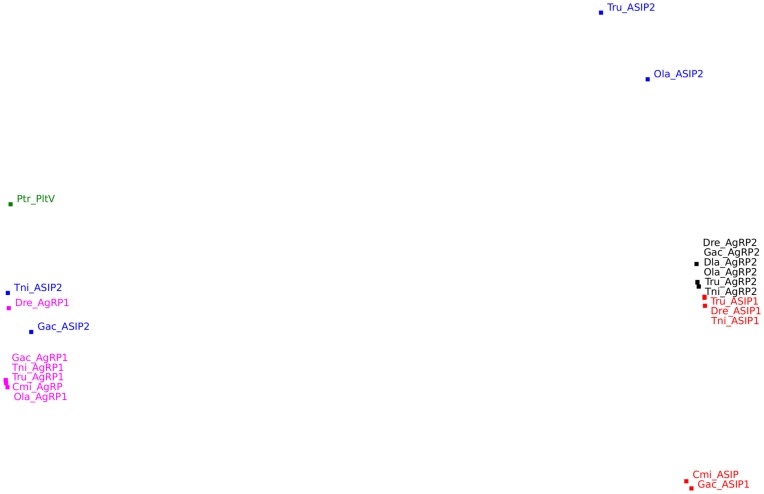
Figure 3. Two-dimensional representation of the similarity relationships between the structure models of A1 and A2 inhibitor cysteine knots, as obtained by non-metric multidimensional scaling.
The MDS fit measures (s-stress = 0.14, RSQ = 0.95) indicate that the inter-model distances in this configuration reflect well the original inter-model dissimilarity values. The figure is generated by a Perl script that outputs support vector graphics. The figure shows that AgRP2 is more ASIP-like, and ASIP2 more AgRP-like, The shift of the A2 points towards ASIP agrees with the Mr. Bayes phylogram. Ptr Plt-VI is more AgRP-like.

