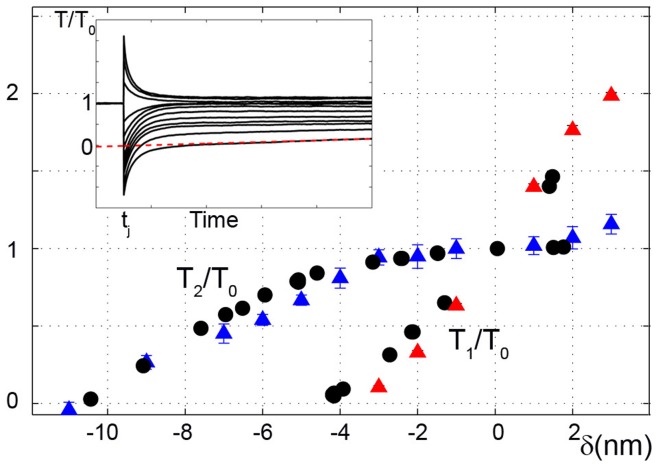
Figure 3. Fast tension recovery.
Simulations and experimental data for a small and fast length step,  , applied to a muscle fiber in isometric contraction. The simulated tensions after the imposed step,
  (red triangles), and after actomyosin re-equilibration,
  (blue triangles), are shown and compared to the experimental results (circles; data from [33]). All tensions are normalized with respect to isometric tension
  . Simulated Tension vs. Time traces are shown in the insert at different
  ,
,  is estimated by the tangent method [41]. Mean values
 standard deviation over 11 trials are shown. Where error bars are not visible, errors are smaller than the symbol width.

