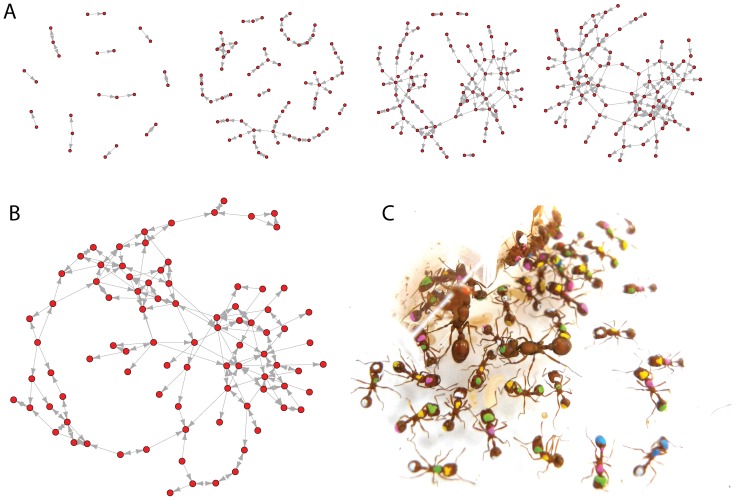
Figure 1. Ant colony interaction networks.
(A) The development of a directed network of interactions between workers in a single P. californicus colony over a period of 60 s. Nodes represent individual workers or queens within a colony and arrows represent interactions between individuals. (B) Example P. californicus interaction network based on 26 s of colony behavior. (C) Photograph of queens and workers within a seed harvester colony; individuals have been painted with unique color combinations to track their interactions.

