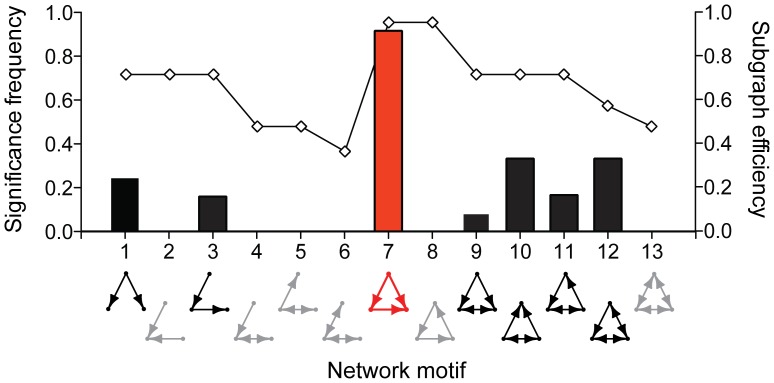
Figure 2. Distribution of network motifs.
Network motif analysis deconstructs a network into its constituent subgraphs and determines whether any of these local-scale interaction patterns are represented more frequently than expected for a randomized network of the same size. The subgraphs that were identified as significant motifs in our analysis of social insect colony networks are plotted above in a summary histogram with relative frequencies on the left axis. The interaction efficiencies of each subgraph are plotted as a line with units along the right axis. One of the two subgraphs with the highest efficiencies, the feed-forward loop (motif 7), was also the most dominant motif observed across the P. californicus interaction networks. Gray subgraphs were not classified as network motifs, black indicates a subgraph identified as a motif within at least one network, and red indicates the only motif that was identified across the majority of networks.

