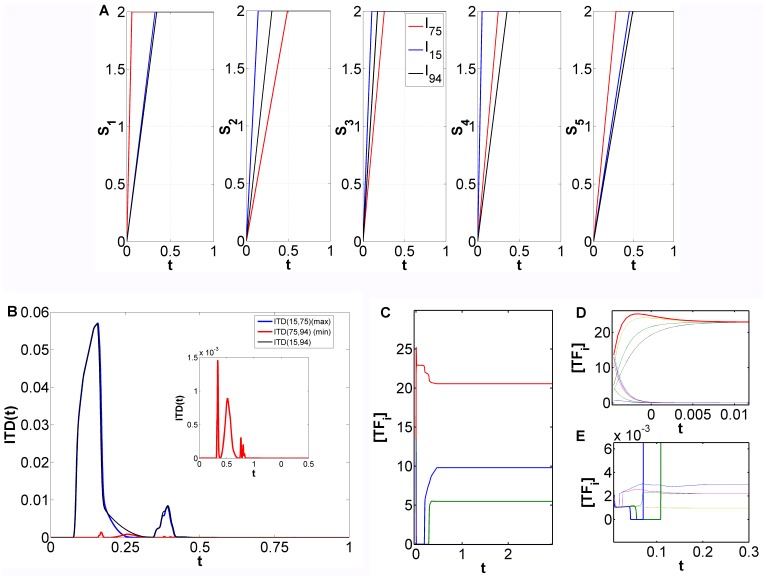
Figure 5. Inter-trajectory distance, profile of specific input combinations and typical switching dynamics.
(A) Time-dependent profile for each input  for 3 input combinations:
  ,
,  ,
,  . (B) Inter-trajectory distance for pairs
  inducing the same attractors (see Fig. 4A). Pairs exhibiting the highest value for
  (Eq. (4)) and the lowest value for
  . Inset: zoom of
  curve for
  . (C) Typical evolution of concentrations for all the nodes
  ,
,  . This particular trajectory was generated by applying
  and noise intensity
  (see Methods). (D) Amplification of (C) for early times t. (E) Amplification of (C) for concentrations
  close to zero.
  , i.e. the concentration of each transcription factor is represented here by
  and associated with
  in Eqs. (7) and (8) with
  (see Methods). Parameters:
  ,
,  ,
,  ,
,  (self-activation) and
  (cross-repression),
  (see Methods), for
  .
.

