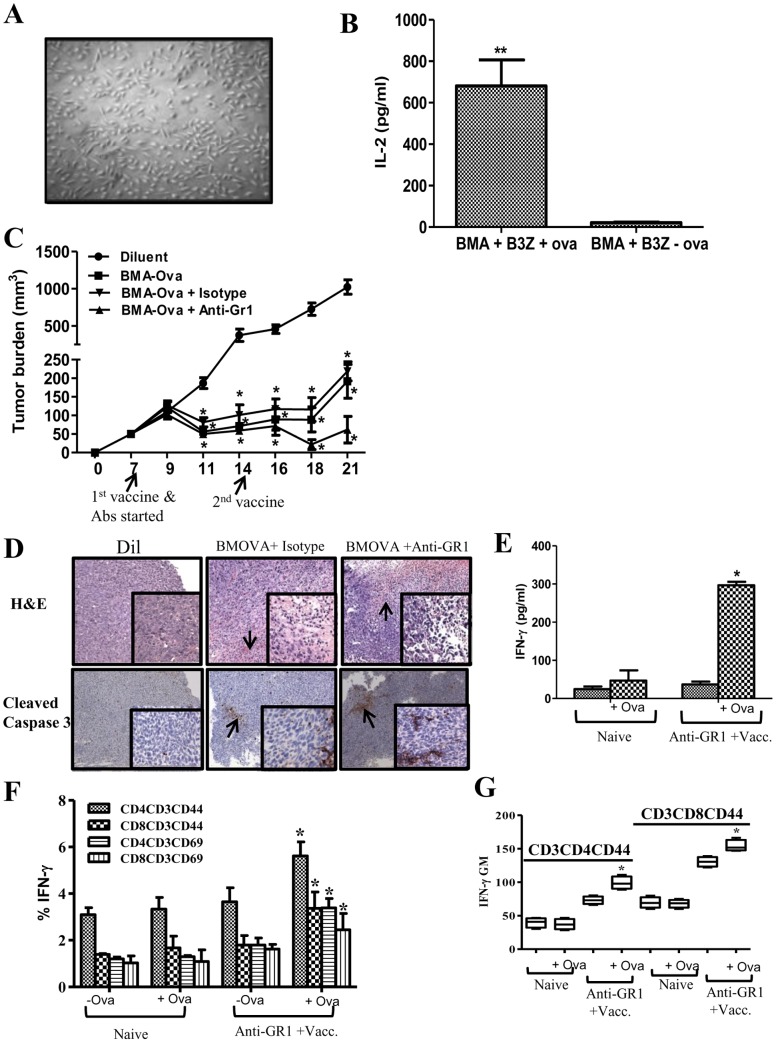
Figure 6. MDSC depletion enhanced vaccination responses.
6A , 14-day BMA culture propagated in CM. 6B , BMA cells processed and presented the OVA protein to activate the CD8 T OVA specific cell line to secrete IL-2. 6C , Tumor volume following vaccination (groups: Diluent, BMA-OVA, BMA-OVA + Isotype and BMA-OVA + anti-Gr1 Ab). 6D , H&E and IHC for cleaved caspase 3 in tumor tissues following vaccination. Arrows indicative of leukocytic infiltrates and cleaved caspase 3 staining in the tumors. 6E–G , Flow cytometry analyses of splenic T cell memory and activation markers from mice that had rejected tumors in the vaccination plus anti-Gr1 treatment group in comparison to non tumor bearing naïve controls; 6E, Splenic production of IFNγ, 6F, Frequency of IFNγ producing CD4 and CD8 memory (CD44) and activation (CD69) marker expressing T cells. 6G, Geometric Mean of IFNγ producing memory T cells from vaccination plus anti-Gr1 treatment following stimulation with OVA protein compared to naïve controls. (Data, mean ± SEM, p values: compared to controls *p<0.05, n = 8 mice/group).

