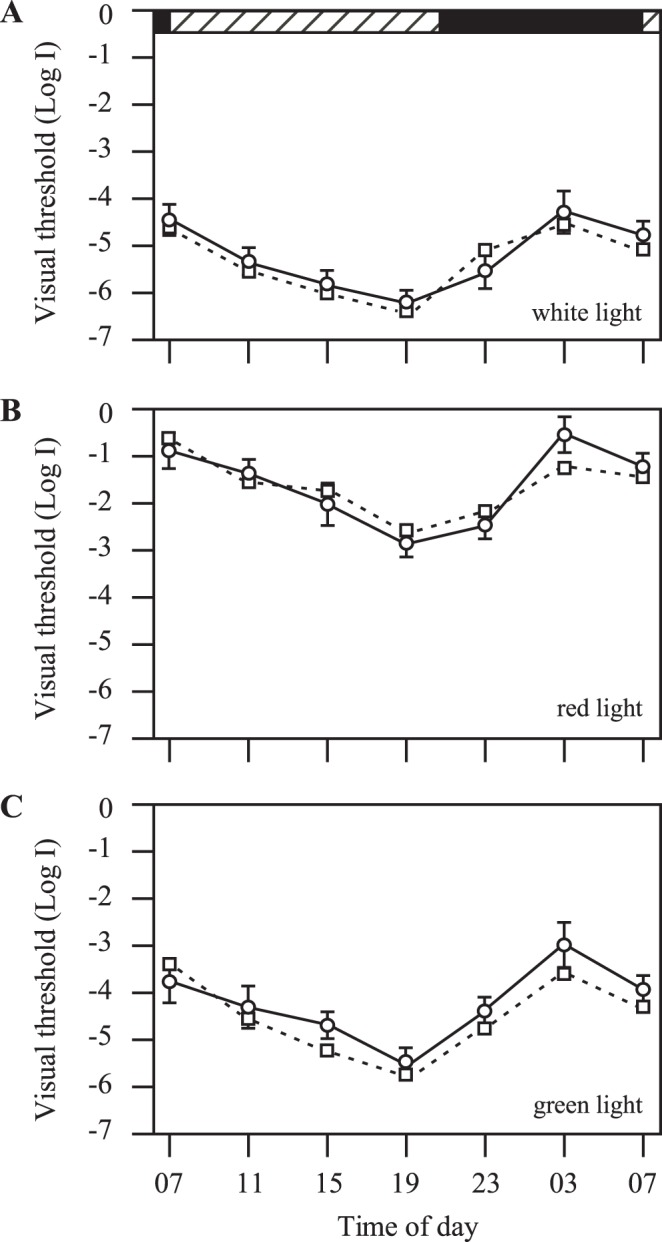
Figure 7. Circadian rhythms of behavioral visual sensitivity in transgenic fish (circles, n = 12) and metronidazole-treated transgenic zebrafish after 25-min of light exposures in the early morning (squares; n = 12).

Threshold measurements were performed with white (A), red (B) and green light (C), respectively. Horizontal hatched and black bars on the top of the panel represent subjective day and night, respectively. Data represents the Means ± SE.
